Microsoft (MSFT) Stock Forecast 2026–2030: Bull, Base, and Bear Cases
See the long-term Microsoft (MSFT) stock forecast for 2026–2030. Explore revenue growth projections, valuation multiples, and three potential price scenarios.
On this page
- How Microsoft makes money
- Where the business stands today
- What to expect from the MSFT price target over the next 12 months
- Microsoft stock forecast for 2030: three scenarios
- The bear case: slowing enterprise growth
- The base case: steady mid-tier expansion
- The bull case: sustained market dominance
- Risks to weigh before investing
- What to watch next
- FAQ
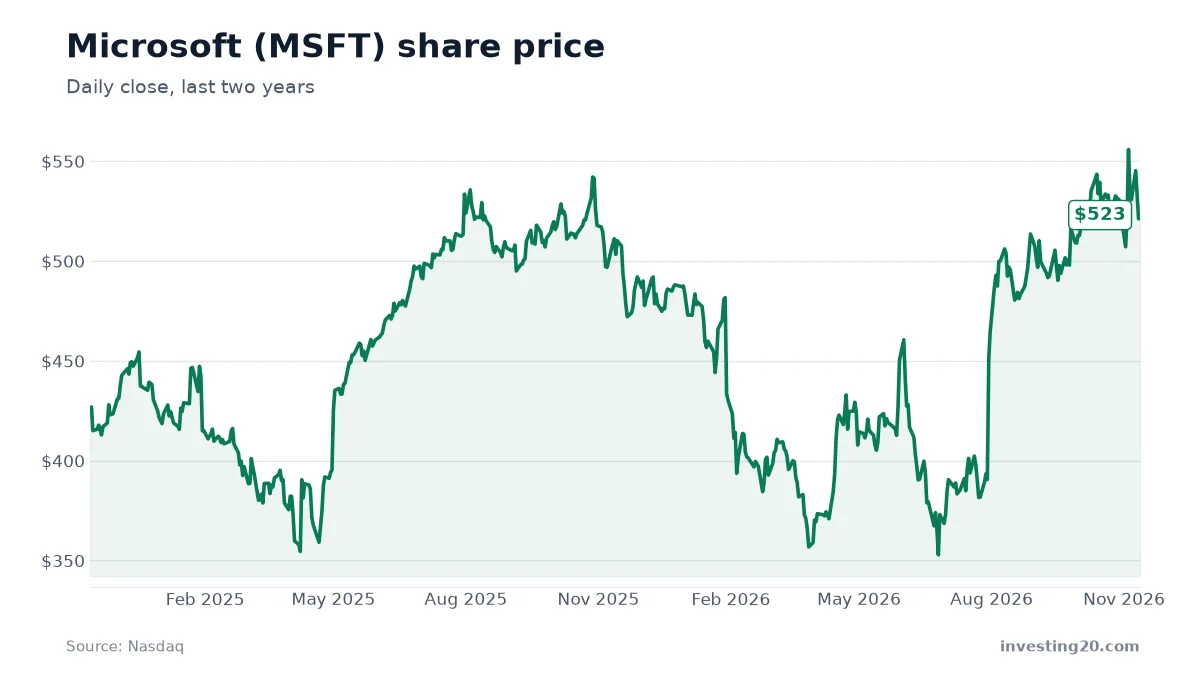
Microsoft (MSFT) remains one of the largest public companies on Earth, carrying a market value of about $3.9 trillion as of November 12, 2026. This article covers Microsoft’s recent business performance, key financial metrics, and valuation scenarios for the stock out to 2030.
Long-range stock forecasts are not exact predictions of where a share price will trade on a given day. Instead, they are structured scenarios that show how specific rates of revenue growth and valuation multiples translate into share prices over time.
| Share price | $523.00 (2026-11-12) |
| Market value | about $3.9 trillion |
| 52-week range | $349.20 – $559.15 |
| Revenue, last 12 months | about $346.4 billion |
| Revenue growth, year over year | 18% |
| Net income, last 12 months | about $142.6 billion |
| Price-to-sales | about 11.2× |
| Price-to-earnings | about 27× |
Market data from Twelve Data as of November 12, 2026. Revenue and net income from the company’s SEC filings. Check current figures before making any decision.
How Microsoft makes money
Microsoft operates across several core divisions, serving individual consumers, small business owners, global enterprises, and public institutions. Its revenue streams rely heavily on recurring software subscriptions and long-term cloud service contracts.
The enterprise technology division sells productivity tools through Microsoft 365, which includes applications like Word, Excel, PowerPoint, and Teams. Companies pay monthly or annual licensing fees per user to access these systems, providing Microsoft with steady cash flow.
The cloud computing business centers around Azure, which provides computing power, data storage, and analytics tools to businesses. Microsoft also generates income through consumer products, including the Windows operating system pre-installed on personal computers, Xbox gaming hardware and content services, and search advertising via Bing.
Where the business stands today
Microsoft generated $346.4 billion in total revenue over the last four reported quarters, growing 17.9% compared to the same period a year earlier. Annual sales have expanded steadily over recent fiscal years, moving from $245.1 billion in the fiscal year ending June 30, 2024, to $281.7 billion in fiscal 2025, and reaching $331.8 billion in fiscal 2026.
Quarterly top-line figures highlight consistent expansion across 2025 and 2026. Microsoft reported $81.27 billion in revenue for the quarter ending December 31, 2025, followed by $82.89 billion for the quarter ending March 31, 2026. Sales rose further to $90.01 billion for the quarter ending June 30, 2026, and hit $92.28 billion in the quarter ending September 30, 2026.
Profitability remains strong. Microsoft delivered $142.6 billion in net income over the last four reported quarters. That represents an increase from $101.8 billion in net income during fiscal 2025 and $133.7 billion in fiscal 2026.
At a recent trading price of $523.00 on November 12, 2026, the stock trades at a price-to-sales ratio of 11.2 and a price-to-earnings ratio of 27.2. The shares have climbed 23.0% from $425.20 on November 13, 2024, trading between a 52-week low of $349.20 and a 52-week high of $559.15.
What to expect from the MSFT price target over the next 12 months
When analyzing a short-term msft price target, investors typically evaluate quarterly earnings reports, enterprise software spending, and capital expenditures. While 12-month analyst target figures offer insight into Near-term Wall Street expectations, they cover a much shorter horizon than multi-year models.
For MSFT stock to sustain upward momentum over the next 12 months, Microsoft will need to maintain steady enterprise adoption across its software portfolio while controlling operating expenses. Broad market shifts can also influence mega-cap tech valuations, as seen during the AI Tech Stock Selloff: Why Debt Fears Sparked Wall Street’s Slide.
Investors looking at short-term equity pricing often monitor broader market derivatives like msft futures and index movement, though actual stock pricing over a year depends heavily on corporate earnings performance and cash flow generation.
Microsoft stock forecast for 2030: three scenarios
To model the msft stock future through 2030, we start from the last four quarters of revenue ($346.4 billion) and apply three distinct growth trajectories. We then apply price-to-sales multiples that reflect how valuations often compress as massive tech firms mature over time.
For context, to maintain today’s share price of $523.00 in 2030 under our base-case valuation assumptions, Microsoft needs to achieve roughly $412.2 billion in annual revenue.
| Scenario | Revenue growth per year | 2030 revenue | Price-to-sales | Shares | Implied share price |
|---|---|---|---|---|---|
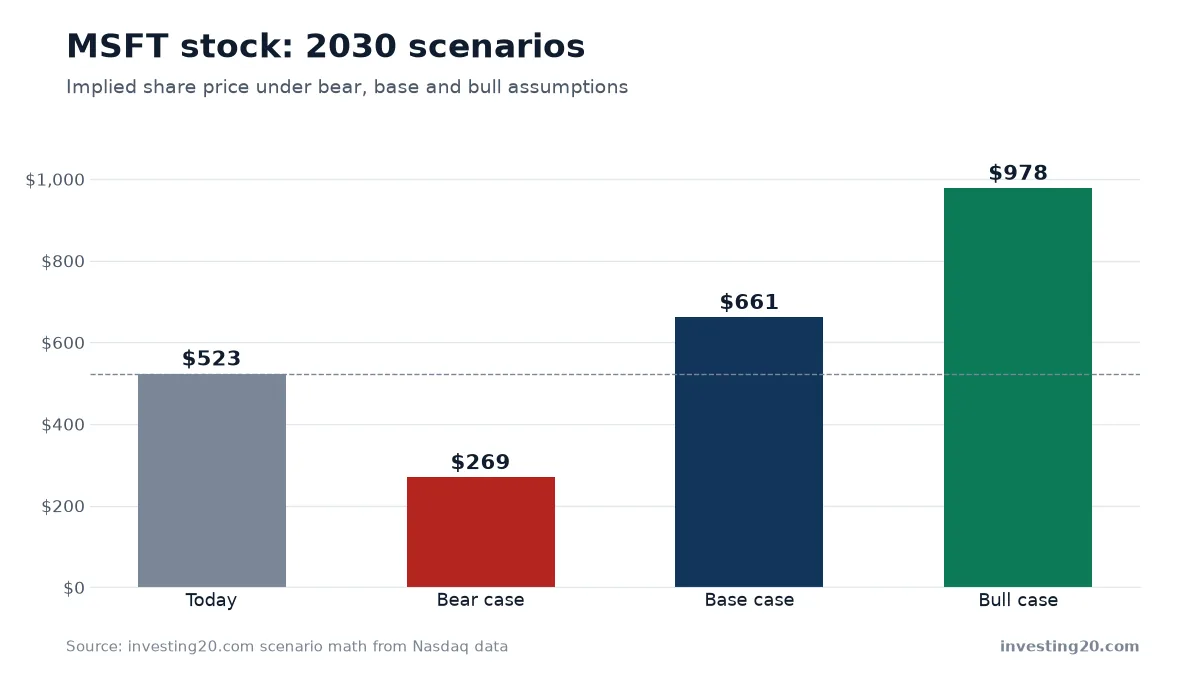
| Bear | 7% | $449.9 billion | 5.0× | 8.36 billion | about $269.11 (-49%) |
| Base | 11% | $521.2 billion | 10.0× | 7.88 billion | about $661.23 (+26%) |
| Bull | 15% | $600.6 billion | 12.3× | 7.58 billion | about $977.72 (+87%) |
The bear case: slowing enterprise growth
In the bear case, annual revenue growth slows to an average of 7% per year, bringing 2030 sales to $449.9 billion. If market sentiment softens and Microsoft’s price-to-sales multiple compresses to 5.0× with 8.36 billion shares outstanding, the implied share price drops to about $269.11, representing a 49% decline from today’s $523.00 level. This path assumes tighter corporate IT budgets and increased competition in enterprise software.
The base case: steady mid-tier expansion
In the base case, revenue grows at an average pace of 11% per year to reach $521.2 billion in 2030. Assuming the price-to-sales multiple moderates slightly to 10.0× and share counts adjust for standard dilution to 7.88 billion, the implied share price reaches about $661.23. That represents a 26% gain from current levels, showing how consistent revenue expansion can offset mild multiple contraction.
The bull case: sustained market dominance
In the bull case, Microsoft maintains revenue growth averaging 15% per year, building annual sales to $600.6 billion by 2030. With strong demand supporting a price-to-sales multiple of 12.3× across 7.58 billion shares, the implied stock price climbs to about $977.72, up 87% from today. This scenario assumes rapid expansion in cloud infrastructure services and high-margin corporate software features.
Comparing mega-cap technology firms shows how valuation math applies across major market leaders. Readers interested in enterprise tech projections can also read our Apple (AAPL) Stock Forecast 2026–2030: Long-Term Scenarios or examine growth trajectories in other sectors via our Rocket Lab (RKLB) Stock Forecast 2026–2030: Long-Term Outlook.
Risks to weigh before investing
While Microsoft holds a commanding position in business software, investors must consider several operational and market risks:
- Valuation contraction: Trading at 11.2 times sales, any broad market shift away from high-multiple growth stocks could compress the share price even if top-line revenue expands.
- Enterprise budget cuts: Economic downturns can lead corporate customers to delay software upgrades, reduce seat licenses, or cut technology spending.
- Capital expenditure requirements: Expanding cloud datacenters and advanced computing infrastructure requires heavy capital outlays, which can pressure free cash flow margins.
- Regulatory oversight: Antitrust regulators in the United States and Europe continue to inspect major tech acquisitions, cross-product bundling, and software distribution practices.
What to watch next
To track whether Microsoft stays on target for its long-term goals, monitor quarterly revenue growth in the Intelligent Cloud segment, particularly Azure performance. Watch overall profit margins to see if software pricing power offsets rising infrastructure investments, and keep an eye on total share count changes from buyback programs.
FAQ
What is the Microsoft stock prediction for 2030?
In our base-case scenario, Microsoft reaches a share price of about $661.23 by 2030 based on 11% average annual revenue growth and a 10.0 price-to-sales multiple. The bull case projects $977.72, while the bear case indicates $269.11.
What is driving the MSFT stock future?
Microsoft generated $346.4 billion in revenue over the last four reported quarters, growing 17.9% year-over-year. Long-term performance relies on sustained demand across enterprise cloud services, software subscriptions, and productivity technology.
What revenue does Microsoft need to support its current share price?
To hold today's share price of $523.00 through 2030 under base-case valuation assumptions, Microsoft needs to generate approximately $412.2 billion in annual revenue.
Market data: Twelve Data. Financials: SEC filings. Scenario math: investing20.
This article is for information only and is not investment advice. Do your own research before investing.