Apple (AAPL) Stock Forecast 2026–2030: Long-Term Scenarios
Explore the Apple (AAPL) stock forecast for 2026 through 2030 with 12-month analyst targets, long-term revenue scenarios, earnings metrics, and key risks.
On this page
Apple trades near all-time highs with a market value around $5.2 trillion. If you own shares in a brokerage account or index fund, you might wonder how much higher a company of this size can realistically grow over the next five years.
This long-range Apple stock prediction looks at where the business stands today and projects where the shares could trade by 2030. Remember that multi-year stock forecasts are not guaranteed predictions. They are scenario models based on reasonable assumptions about sales growth, profit margins, and market valuations.
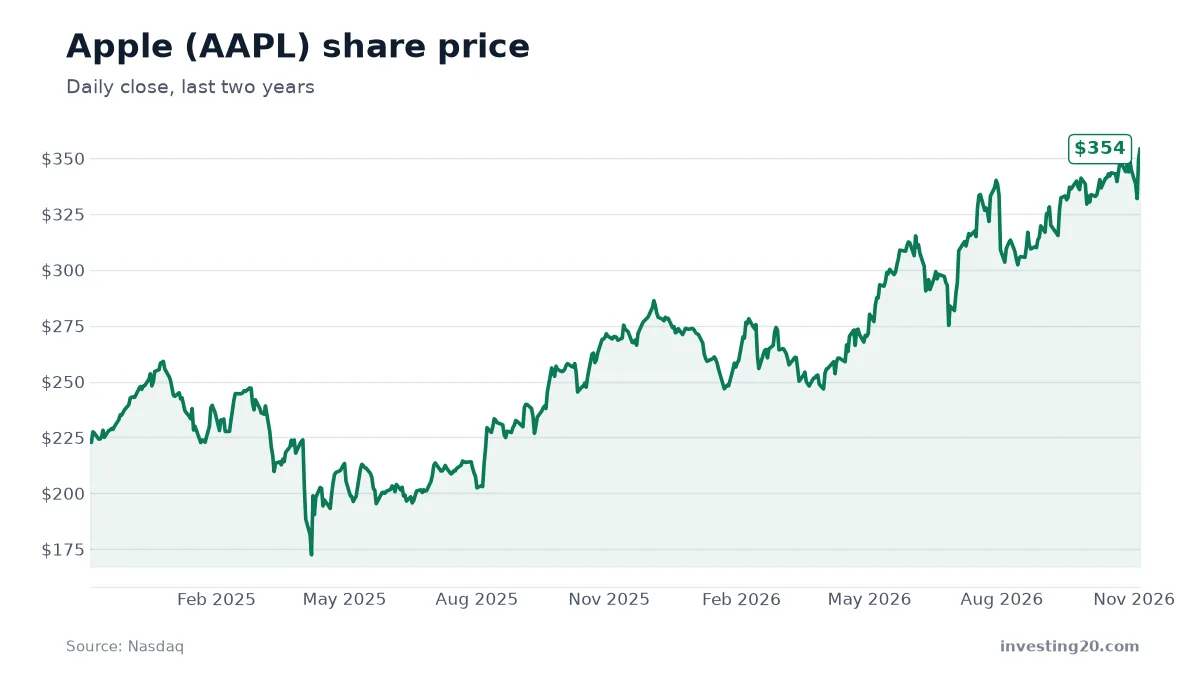
| Share price | $354.05 (Nov 5, 2026 8:02 AM ET) |
| Market value | about $5.2 trillion |
| 52-week range | $243.42 – $354.50 |
| Revenue, last 12 months | about $478.8 billion |
| Revenue growth, last fiscal year | 15% |
| Net income, last 12 months | about $132.2 billion |
| Price-to-sales | about 10.8× |
| Price-to-earnings | about 39× |
| Analyst 12-month target | average $339.75 (range $250 – $400); 15 buy, 9 hold, 5 sell |
Market data from Nasdaq as of November 5, 2026. Check current figures before making any decision.
What Apple does: products, software, and services
Apple built its global presence by hardware innovation starting with the Macintosh computer in 1984. Today, the core product lineup includes the iPhone, Mac, iPad, AirPods, Apple Watch, and Apple Vision Pro.
These devices run on six proprietary operating systems: iOS, iPadOS, macOS, watchOS, visionOS, and tvOS. The tightly linked ecosystem connects users across devices and delivers software services such as the App Store, Apple Music, Apple Pay, iCloud, and Apple TV.
Apple generates revenue through direct product sales, software subscriptions, transaction fees, and digital media. With a global workforce of more than 150,000 employees, the company relies on user retention within its hardware and service ecosystem to drive recurring sales upgrades and high-margin service billings.
Where the business stands: revenue and profit performance
Apple’s financial results show consistent momentum over recent years. For the fiscal year ending September 26, 2026, total revenue reached $478.8 billion, representing a 15.1% growth rate over the $416.2 billion recorded in fiscal year 2025. That follows revenue of $391.0 billion in fiscal year 2024.
Net income for the last four reported quarters hit $132.2 billion, up from $112.0 billion in fiscal year 2025. Quarter by quarter, Apple generated $143.76 billion in the period ending December 27, 2025, followed by $111.18 billion for the quarter ending March 28, 2026, $109.42 billion for the quarter ending June 27, 2026, and $114.48 billion for the quarter ending September 26, 2026.
Fiscal Year Revenue ($ Billions)
FY 2024: $391.0B
FY 2025: $416.2B
FY 2026: $478.8B (+15.1%)
The company has consistently beat quarterly earnings expectations set by Wall Street analysts over the past year:
- Quarter ending Sep 26, 2026: Reported EPS of $2.05 versus consensus of $1.98 (3.54% beat).
- Quarter ending Jun 27, 2026: Reported EPS of $1.91 versus consensus of $1.88 (1.60% beat).
- Quarter ending Mar 28, 2026: Reported EPS of $2.01 versus consensus of $1.92 (4.69% beat).
- Quarter ending Dec 27, 2025: Reported EPS of $2.84 versus consensus of $2.65 (7.17% beat).
Apple trades at a price-to-earnings (P/E) ratio of 39.1 and a price-to-sales (P/S) ratio of 10.8 based on the last four quarters of earnings and revenue. The stock yields a 0.31% dividend. Over the past two years, the share price rose from $223.45 on November 5, 2024, to $354.05 on November 5, 2026, a gain of 58.4%. During this two-year stretch, shares dipped to a low of $172.42 on April 8, 2025, before climbing to a high of $354.50.
AAPL stock forecast for the next 12 months
Wall Street analysts tracking Apple maintain a cautious short-term view on the stock’s valuation. Out of 29 analysts surveyed by Nasdaq, 15 recommend a buy, 9 suggest a hold, and 5 advise a sell.
The consensus 12-month average AAPL stock target price stands at $339.75, which sits about 4.0% below the current share price of $354.05. Individual targets stretch from a low of $250.00 to a high of $400.00. Because the stock ran up significantly to hit record levels near $354.50, the average 12-month target implies that analysts see limited near-term upside until earnings catch up with the current valuation multiple.
Looking at earnings projections for the coming fiscal years, analysts expect earnings per share (EPS) to grow steadily:
- FY 2027 (ending Sep 2027): Consensus EPS of $9.61 (based on 11 analysts).
- FY 2028 (ending Sep 2028): Consensus EPS of $10.96 (based on 5 analysts).
- FY 2029 (ending Sep 2029): Consensus EPS of $12.25 (based on 3 analysts).
For Apple stock to hit the upper analyst price target of $400 over the next 12 months, the company would need to maintain double-digit revenue expansion and continue beating quarterly profit consensus numbers while expanding its high-margin services division.
Evaluating long-term valuation trends across megacap tech and AI supply chains, such as modeled in our Super Micro Computer (SMCI) Stock Forecast, shows how shifting growth expectations impact valuation multiples over time.
AAPL stock forecast for 2030: three scenarios
To model the future Apple stock trajectory out to 2030, we evaluate three potential scenarios using revenue growth, share count adjustments, and valuation multiples.
The baseline model starts from Apple’s last-four-quarters revenue of $478.8 billion. To reach a break-even point where the stock maintains today’s $354.05 price at a 10.0x price-to-sales multiple, Apple would need to generate approximately $548.4 billion in annual revenue by 2030.
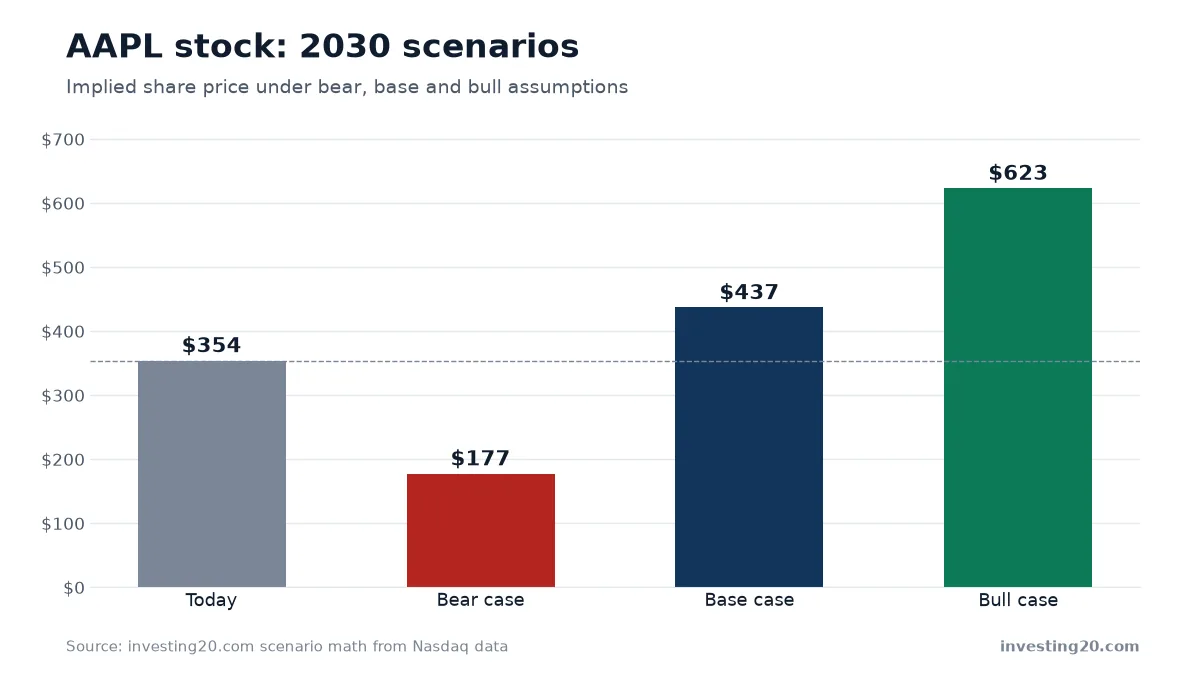
| Scenario | Revenue growth per year | 2030 revenue | Price-to-sales | Shares | Implied share price |
|---|---|---|---|---|---|
| Bear | 5% | $582.8 billion | 5.0× | 16.43 billion | about $177.41 (-50%) |
| Base | 9% | $676.8 billion | 10.0× | 15.49 billion | about $436.95 (+23%) |
| Bull | 13% | $781.7 billion | 11.9× | 14.89 billion | about $623.24 (+76%) |
Bear case scenario
In the bear case, annual revenue growth slows to about 5% per year, bringing 2030 annual revenue to $582.8 billion. If market sentiment cools and Apple’s price-to-sales multiple contracts from today’s 10.8x down to 5.0x, a valuation closer to traditional mature tech hardware producers, the stock would trade around $177.41. That represents a 50% decline from current levels, assuming 16.43 billion outstanding shares due to reduced share buybacks or moderate share dilution.
Base case scenario
The base case assumes Apple grows revenue at an average pace of 9% annually, reaching $676.8 billion in revenue by 2030. Assuming buybacks reduce diluted shares to 15.49 billion and the market values the business at a 10.0x price-to-sales ratio (close to today’s 10.8x multiple), the stock would reach about $436.95. That reflects a 23% gain above today’s price.
Bull case scenario
In the bull case, new hardware adoption, spatial computing, and expanded AI software subscriptions push annual revenue growth to an average of 13% per year, lifting 2030 revenue to $781.7 billion. If aggressive share repurchases lower the total share count to 14.89 billion and market demand keeps the price-to-sales multiple at 11.9x, the implied stock price reaches $623.24. This outcome represents a 76% gain from today’s $354.05 level.
When comparing long-term growth trajectories across mature mega-caps versus emerging technology hardware, examining scenarios like the Tesla (TSLA) Stock Forecast or specialized software plays like the SoundHound AI (SOUN) Stock Forecast provides helpful context on how market multiples adjust as industries mature.
Risks to weigh
Before making investment choices, consider the primary risks facing Apple over the next several years:
- High valuation multiples: Trading at 39.1 times trailing earnings and 10.8 times sales, Apple stock leaves little room for earnings misses or slower top-line growth.
- Geopolitical and supply chain exposure: Manufacturing reliance on overseas supply chains leaves Apple vulnerable to trade disputes, tariffs, and localized production disruptions.
- Regulatory scrutiny: Ongoing antitrust enforcement targeting App Store commission rates and default search placement agreements could pressure high-margin service revenue.
- Hardware upgrade cycles: Longer consumer phone replacement cycles and market saturation in mature economies could temper hardware sales growth.
- Macroeconomic spending: Weakening global consumer discretionary spending could reduce demand for premium hardware devices and digital subscriptions.
What to watch next
If you hold or plan to buy Apple shares, keep an eye on upcoming quarterly earnings releases to track whether quarterly revenue growth stays near or above the recent 15% rate. Watch for updates on iPhone replacement cycles, new spatial computing products, and service business margin expansion.
Pay close attention to share buyback execution. Apple’s ongoing share reduction is essential for supporting long-term EPS growth even during quarters when total revenue growth slows. Track Wall Street’s revised 2027 and 2028 earnings forecasts after each earnings report to see if analysts raise or lower their multi-year growth targets.
FAQ
What is the 12-month AAPL stock target price?
Wall Street analysts set an average 12-month price target of $339.75 for Apple shares, with price targets ranging from a low of $250.00 to a high of $400.00.
What is the Apple stock prediction for 2030?
In a base-case valuation scenario assuming 9% annual revenue growth and a 10.0x price-to-sales multiple, Apple stock reaches an implied price of about $436.95 by 2030. The bull case implies $623.24, while the bear case suggests $177.41.
How fast is Apple growing its revenue and net income?
For the fiscal year ending September 26, 2026, Apple reported $478.8 billion in revenue, representing a 15.1% increase over the previous fiscal year. Net income for the same period reached $132.2 billion.
What is the consensus earnings forecast for future Apple stock performance?
Analysts project Apple's earnings per share to reach $9.61 in fiscal year 2027, $10.96 in fiscal year 2028, and $12.25 in fiscal year 2029.
Market data and financials: Nasdaq. Scenario math: investing20.
This article is for information only and is not investment advice. Do your own research before investing.