Uber Technologies (UBER) Stock Forecast 2026–2030
Looking for an Uber stock forecast? See Wall Street 12-month price targets and long-term 2026–2030 scenarios based on revenue growth and valuation.
On this page
- What Uber Technologies does
- Where the business stands
- UBER stock forecast for the next 12 months
- What are the Uber stock projections for 2030?
- The bear case: growth slows sharply
- The base case: steady double-digit compounding
- The bull case: advertising and mobility accelerate
- Risks to weigh
- What to watch next
- FAQ
This Uber Technologies stock forecast breaks down where the business stands today and maps out realistic paths for the share price through 2030. If you follow large tech platforms, you know Uber has shifted from a cash-burning ride app into a profitable global network, but recent market volatility shows investors still debate its long-term margin profile.
Before looking ahead, remember that any five-year stock forecast is a tool to test assumptions, not a guarantee. We evaluate financial targets by modeling how revenue expansion, profit multiples, and share dilution interact over time.
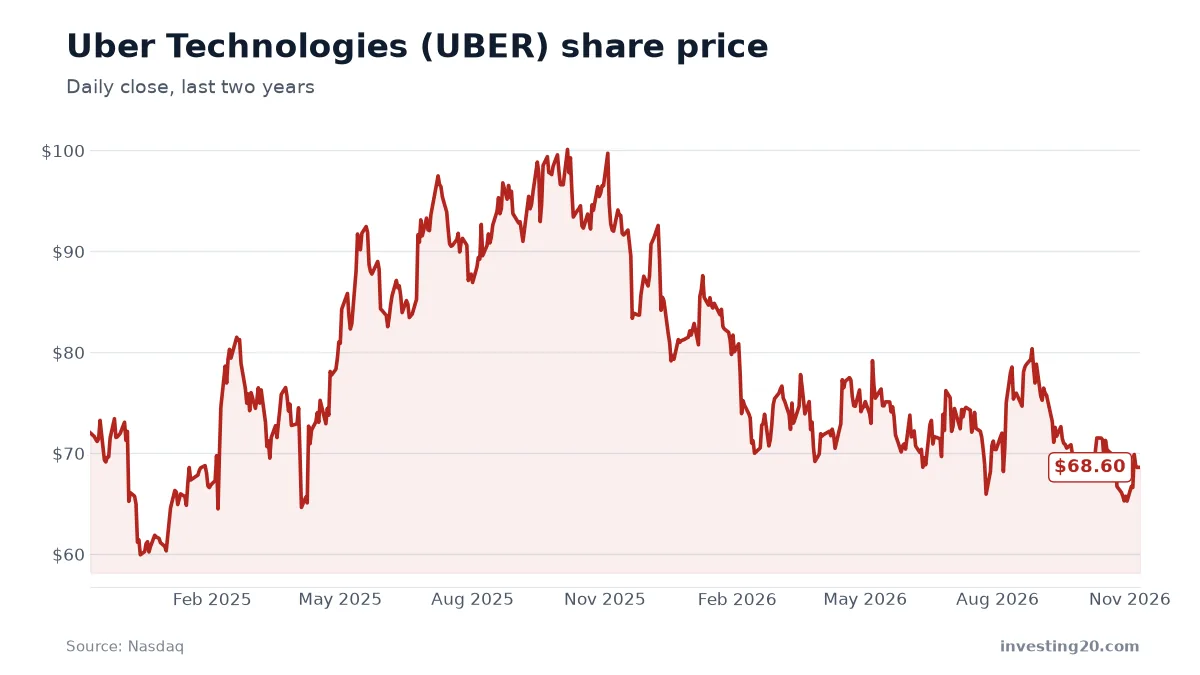
| Share price | $68.60 (Nov 6, 2026) |
| Market value | about $140.1 billion |
| 52-week range | $64.04 – $95.18 |
| Revenue, last 12 months | about $56.5 billion |
| Revenue growth, last fiscal year | 18% |
| Net income, last 12 months | about $3.5 billion |
| Price-to-sales | about 2.5× |
| Price-to-earnings | about 40× |
| Analyst 12-month target | average $103.18 (range $70 – $150); 22 buy, 2 hold, 0 sell |
Market data from Nasdaq as of November 8, 2026. Check current figures before making any decision.
The table above highlights the baseline figures from Nasdaq as of November 8, 2026. At $68.60 per share, Uber trades at roughly 2.5 times trailing sales and 40.4 times earnings, sitting much closer to its 52-week low of $64.04 than its peak of $95.18.
What Uber Technologies does
Uber Technologies got its start in 2010 trying to solve a simple issue: booking a reliable ride from a smartphone button. Since then, the platform has facilitated more than 83 billion trips worldwide.
Today, the company acts as a transportation and logistics backbone across three core product pillars: Mobility, Delivery, and Freight. Mobility connects riders with drivers for daily commuting, airport runs, and shared transit. Delivery, centered on Uber Eats, connects consumers with restaurants, grocery stores, and local retailers. The freight business connects shippers with carriers to move commercial cargo across supply chains.
Uber makes money primarily by taking a cut from each transaction. Drivers and delivery couriers earn money on trips, while Uber collects platform fees and service charges. The company also generates high-margin revenue from advertising across its apps, letting merchants and brands pay for premium placement when users search for food or rides.
Where the business stands
Uber’s top-line revenue has climbed steadily over the past few years. Full-year revenue stood at $37.3 billion in 2023, grew to $44.0 billion in 2024, and reached $52.0 billion in 2025. That represented an 18.3% annual growth rate for fiscal 2025. Over the last four reported quarters, total revenue reached $56.5 billion.
Recent quarterly performance shows consistent top-line expansion, moving from $14.37 billion in the quarter ending December 31, 2025, to $13.20 billion in March 2026, $14.19 billion in June 2026, and $14.77 billion in the quarter ending September 30, 2026.
Profitability, however, has experienced some uneven quarters. For fiscal 2024, net income was $9.9 billion, followed by $10.1 billion in 2025. Over the trailing four quarters, net income sits at $3.5 billion.
Earnings per share have swung widely against Wall Street expectations over the past year:
- December 2025: EPS of $0.71 missed the $0.79 consensus by 10.13%.
- March 2026: EPS of $0.72 beat the $0.70 consensus by 2.86%.
- June 2026: EPS of $1.17 topped the $0.83 consensus by 40.96%.
- September 2026: EPS of $0.25 trailed the $0.94 consensus by 73.4%.
That sharp drop in September 2026 profits explains why the stock has traded down toward the low end of its 52-week range. As with mature tech giants like Apple, market sentiment shifts quickly whenever earnings consistency slips.
UBER stock forecast for the next 12 months
Despite quarterly earnings swings, Wall Street analysts remain broadly optimistic on the stock. Among 24 analysts tracked by Nasdaq, 22 rate the shares a buy, 2 rate them a hold, and zero rate them a sell.
The consensus 12-month price target for Uber is $103.18, with estimates spanning from a low of $70.00 to a high of $150.00. That average price target implies an upside of about 50.4% from the recent price of $68.60.
For that 12-month uber stock prediction to play out, Uber would need to stabilize its earnings margins and deliver on upcoming profit goals. Analyst consensus estimates project full-year EPS of $3.14 for 2026, rising to $4.55 in 2027 and $5.80 in 2028. Hitting that $103 mark requires the market to reward Uber’s cash generation rather than punishing one-off quarterly misses.
What are the Uber stock projections for 2030?
To look further ahead, we use a simple valuation model based on revenue milestones, share dilution, and price-to-sales ratios. Uber generated $56.5 billion over its last four quarters, and it trades at 2.5 times sales.
To understand the baseline, consider what the current share price already discounts: at our base-case valuation multiple of 2.5 and 2.17 billion shares, Uber needs roughly $60.0 billion in 2030 revenue just to justify today’s $68.60 share price. Because it is already running at $56.5 billion annualized, today’s price requires very modest growth to hold its ground.
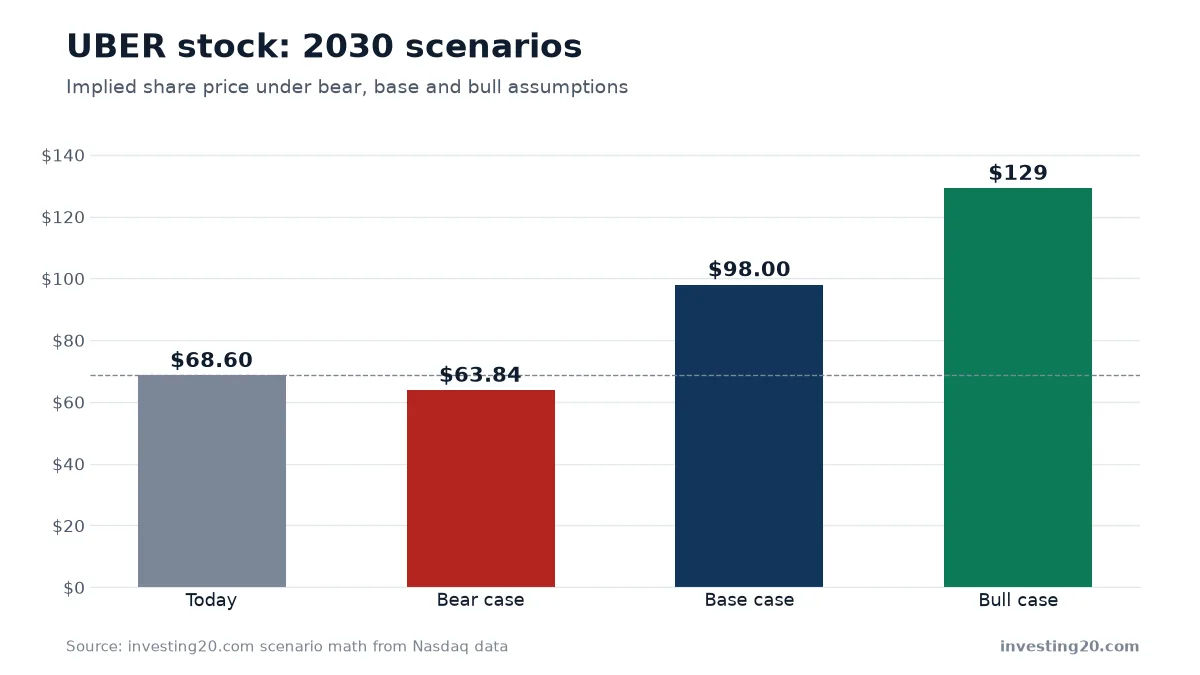
Here is how three distinct long-range scenarios look through 2030:
| Scenario | Revenue growth per year | 2030 revenue | Price-to-sales | Shares | Implied share price |
|---|---|---|---|---|---|
| Bear | 7% | $74.0 billion | 2.0× | 2.30 billion | about $63.84 (-7%) |
| Base | 11% | $85.7 billion | 2.5× | 2.17 billion | about $98.00 (+43%) |
| Bull | 15% | $98.8 billion | 2.7× | 2.08 billion | about $129.23 (+88%) |
The bear case: growth slows sharply
In the bear scenario, revenue growth moderates to an average of 7% per year, bringing 2030 revenue to $74.0 billion. Slower growth pushes the price-to-sales multiple down to 2.0. Factoring in moderate dilution to 2.30 billion shares, the implied share price lands at $63.84, about 7% below today’s price. This scenario reflects intense platform competition, regulatory overhead, or macroeconomic softness dragging on consumer travel.
The base case: steady double-digit compounding
The base case assumes annual top-line growth averages 11% through 2030, taking revenue to $85.7 billion. If Uber maintains its current 2.5 price-to-sales multiple and keeps the share count around 2.17 billion, the implied price comes out to $98.00 per share, a 43% gain. Similar to the platform scaling we examine in our SoFi Technologies forecast, this path depends on steady expansion in delivery margins and recurring enterprise subscriptions.
The bull case: advertising and mobility accelerate
In the bull scenario, revenue expands at 15% annually, reaching $98.8 billion by 2030. As margins widen from digital advertising and operational efficiency, investors award Uber a slightly higher multiple of 2.7 times sales. Assuming buybacks limit share dilution to 2.08 billion shares, the stock reaches $129.23, an 88% advance from recent levels.
The main takeaway from these projections is that Uber does not need extreme valuation expansion to deliver decent returns. As long as top-line revenue compounds above 10% annually without excessive share dilution, the stock offers positive long-term upside.
Risks to weigh
Before making any investment decision, consider the risks that could disrupt these targets:
- Quarterly margin volatility: As the September 2026 earnings miss showed, quarterly net income can fluctuate heavily due to legal expenses, tax adjustments, or incentive spend.
- Driver classification and labor rules: Ongoing legal battles and regulatory changes around gig-worker benefits can suddenly raise operating costs in major domestic and European markets.
- Autonomous vehicle competition: Long-term disruption from self-driving vehicle networks could challenge Uber’s driver-based marketplace, requiring expensive capital partnerships.
- Consumer spending cutbacks: Rides and food delivery are discretionary purchases. A broad economic pullback can quickly cut order frequency, a vulnerability shared across app-driven platforms like those in our Robinhood stock outlook.
What to watch next
If you are tracking Uber, the first metric to watch is whether quarterly earnings per share rebound back toward the full-year consensus estimate of $3.14. Consistent profit delivery will determine whether the stock can break out of its current slump.
Beyond near-term earnings, monitor gross bookings growth across Mobility and Delivery, along with the adoption of higher-margin advertising products. These operating levers will show whether the base-case revenue goal of $85.7 billion by 2030 remains on track.
FAQ
What is the 12-month price target for Uber stock?
Nasdaq consensus data shows an average 12-month price target of $103.18, ranging from a low of $70.00 to a high of $150.00. That average suggests about 50.4% upside from the recent price of $68.60.
What is the Uber stock prediction for 2030?
In our base-case scenario, Uber reaches around $98.00 per share by 2030, assuming 11% annual revenue growth to $85.7 billion and a price-to-sales multiple of 2.5. The bear case models $63.84, while the bull case reaches $129.23.
Is Uber profitable today?
Yes. Uber generated $3.5 billion in net income over its last four reported quarters, though quarterly earnings can vary significantly, as seen in late 2026.
Market data: Nasdaq. Financials: Nasdaq. Scenario math: investing20.
This article is for information only and is not investment advice. Do your own research before investing.