SoFi Technologies (SOFI) Stock Forecast 2026–2030
Where could SoFi Technologies stock head by 2030? Explore analyst targets, financial results, and realistic bull, base, and bear price scenarios.
On this page
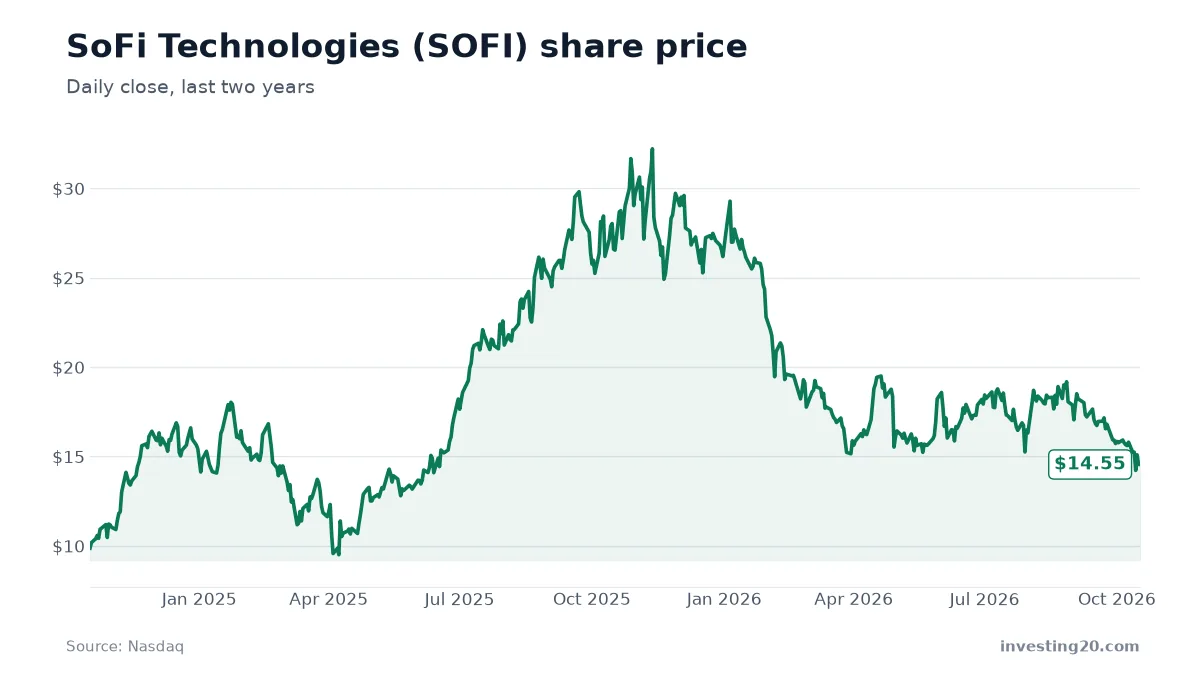
SoFi Technologies (SOFI) traded at $14.82 on November 16, 2026, down significantly from its 52-week high of $30.42. If you hold SOFI in your portfolio or are deciding whether to buy, the main question is whether its business growth can eventually support its current market valuation.
Long-range stock forecasts are not absolute price predictions. They are scenario models that map out what happens under different combinations of revenue growth rates, share dilution, and valuation multiples. This article looks at where SoFi stands today and models potential outcomes for 2030.
| Share price | $14.82 (2026-11-16) |
| Market value | about $19.2 billion |
| 52-week range | $13.86 – $30.42 |
| Revenue, last 12 months | about $616.8 million |
| Revenue growth, year over year | 6% |
| Net income, last 12 months | about $737.9 million |
| Price-to-sales | about 31.2× |
| Price-to-earnings | about 26× |
Market data from Twelve Data as of November 16, 2026. Revenue and net income from the company’s SEC filings. Check current figures before making any decision.
What changed since our last update
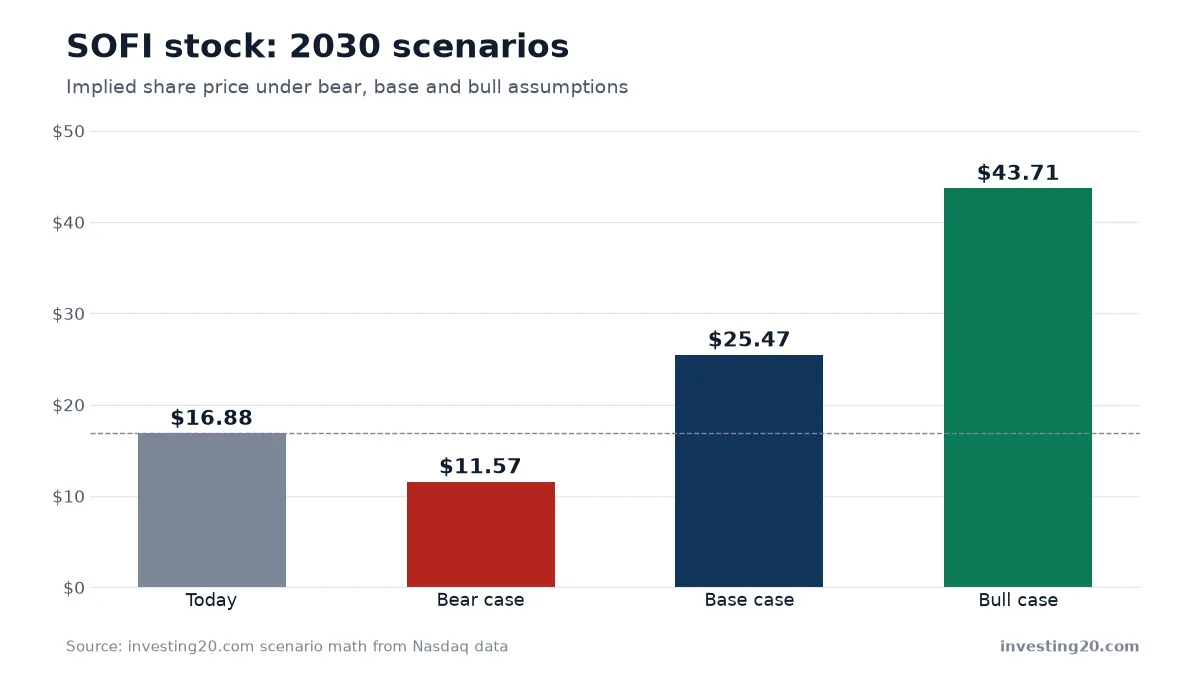
Since our last update on October 28, 2026, SoFi’s share price dropped 12.2% from $16.88 to $14.82. In our previous update, average analyst target data stood at $20.82, while our previous 2030 implied share prices ranged from $11.57 in the bear case to $43.71 in the bull case.
The updated 2030 model reflects lower terminal price-to-sales multiples for mature financial growth stocks, bringing down the broad target ranges across all three long-term scenarios.
What SoFi Technologies does
SoFi Technologies operates in financial services, providing digital-first consumer banking and lending products. It acts as an all-in-one financial app offering student loan refinancing, personal loans, home loans, credit cards, and checking or savings accounts.
The company earns revenue through net interest income on the loan balances it holds, gain-on-sale margins when selling loans into secondary credit markets, and transaction fees across its digital investing and banking products. Similar to digital investment platforms discussed in our Robinhood Markets (HOOD) Stock Forecast, SoFi relies on adding new member accounts and expanding the number of financial products each client uses.
Where the business stands
SoFi’s annual revenue rose from $421.5 million in fiscal year 2023 to $503.1 million in 2024, reaching $619.4 million in fiscal year 2025. Over the last four reported quarters ending September 30, 2026, total revenue was $616.8 million, representing a 5.5% increase compared to the same period a year earlier.
Looking at recent quarter-by-quarter numbers, SoFi brought in $170.29 million for the quarter ending December 31, 2025, followed by $129.50 million for the quarter ending March 31, 2026. Revenue rose to $153.58 million for the quarter ending June 30, 2026, and hit $163.40 million in the quarter ending September 30, 2026.
Net income over the last four reported quarters reached $737.9 million, compared to $481.3 million in fiscal 2025 and $498.7 million in fiscal 2024. The stock carries a market value of $19.2 billion. That puts its price-to-sales ratio at 31.2 and its price-to-earnings ratio at 26.1 based on trailing twelve-month figures.
SOFI stock forecast for the next 12 months
Over the next year, SoFi’s stock performance will depend heavily on its ability to speed up top-line growth while maintaining solid margins. With recent four-quarter revenue growth tracking at 5.5%, investors will watch closely to see if quarterly sales can re-accelerate toward previous record highs.
Key items to monitor over the next 12 months include:
- Loan origination trends across personal loans, student loan refinancing, and mortgages as interest rates fluctuate.
- The growth rate of net income relative to underlying quarterly revenue shifts.
- Valuation compression risks, given that a price-to-sales multiple of 31.2 is high compared to broader commercial banks and fintech lenders.
Evaluating valuations across tech-focused financial models is standard when looking at companies like those featured in our Uber Technologies (UBER) Stock Forecast or fintech peers.
SOFI stock forecast for 2030: three scenarios
Long-term modeling requires making assumptions about sales growth, future share count, and the multiple investors will pay for revenue. Today’s price-to-sales ratio of 31.2 is typical for early-stage software companies, but mature financial institutions usually trade at lower multiples.
To break even at a base-case price-to-sales multiple of 10.0 and a share count of 1.30 billion, SoFi would need to generate approximately $1.9 billion in annual revenue by 2030 just to maintain its current $14.82 share price.
| Scenario | Revenue growth per year | 2030 revenue | Price-to-sales | Shares | Implied share price |
|---|---|---|---|---|---|
| Bear | -1% | $599.8 million | 5.0× | 1.35 billion | about $2.22 (-85%) |
| Base | 3% | $702.4 million | 10.0× | 1.30 billion | about $5.41 (-63%) |
| Bull | 7% | $817.7 million | 18.0× | 1.25 billion | about $11.81 (-20%) |
Bear case
The bear case assumes annual revenue declines slightly by about 1% per year on average, bringing 2030 revenue to $599.8 million. Assuming share dilution pushes the total share count to 1.35 billion and the price-to-sales multiple contracts to a conservative 5.0, the implied share price drops to about $2.22, an 85% decline from current levels.
Base case
In the base case, revenue grows at an average pace of 3% per year to reach $702.4 million by 2030. If the share count expands to 1.30 billion and the price-to-sales ratio settles at 10.0, the implied share price is about $5.41. That represents a 63% decline from today’s price, reflecting the pressure of multiple contraction even with steady top-line growth.
Bull case
The bull case models a faster revenue expansion of 7% per year on average, pushing 2030 revenue to $817.7 million. Assuming controlled dilution keeps the share count to 1.25 billion and investors reward the company with an 18.0 price-to-sales multiple, the implied stock price reaches about $11.81. This represents a 20% decline from the current price of $14.82.
The key takeaway from these scenarios is that today’s high price-to-sales multiple of 31.2 creates valuation drag. If the market eventually values SoFi closer to typical financial institutions, the company will need significantly higher revenue expansion than recent trends show to generate positive returns from current price levels. Readers interested in high-multiple scenario models can also review our Rocket Lab (RKLB) Stock Forecast.
Risks to weigh
Before making any investment decisions regarding SOFI, keep the following risks in mind:
- Valuation Compression: A price-to-sales ratio above 31 leaves little room for error if revenue growth remains in the single digits.
- Credit Quality and Delinquencies: Unfavorable economic shifts could increase loan default rates across personal and unsecured credit lines.
- Share Dilution: Stock-based compensation or capital raises could increase the share count over time, reducing the earnings and revenue per share.
- Refinancing Demand: Changes in benchmark interest rates directly impact consumer demand for student loan and mortgage refinancing.
What to watch next
If you own or are following SoFi Technologies, watch the upcoming quarterly earnings filings to track whether revenue growth begins to re-accelerate above 5.5%.
Specifically, look at whether quarterly revenue can consistently climb above the $170 million mark seen in late 2025, and monitor whether net profit margins hold steady as loan volumes adjust. Keep an eye on the share count in SEC filings to evaluate how dilution affects long-term per-share value.
FAQ
What is the long-term outlook for SoFi Technologies (SOFI) stock?
SoFi's long-term performance depends on accelerating revenue growth while managing dilution and valuation multiples. Our 2030 model spans from a bear case of $2.22 to a bull case of $11.81, assuming today's high sales valuation compresses over time.
Is SoFi Technologies profitable?
Yes, SoFi reported $737.9 million in net income over the last four reported quarters, alongside total revenue of $616.8 million during the same period.
What is SoFi's current price-to-sales ratio?
As of November 16, 2026, SoFi trades at a price-to-sales ratio of about 31.2 based on revenue over the last four reported quarters.
Market data: Twelve Data. Financials: SEC filings. Scenario math: investing20.
This article is for information only and is not investment advice. Do your own research before investing.