Robinhood Markets (HOOD) Stock Forecast: 2026–2030 Scenarios
Robinhood Markets (HOOD) stock forecast for 2026 to 2030 with realistic bull, base, and bear price scenarios based on revenue growth and valuation multiples.
On this page
- What changed since our last update
- What Robinhood Markets does
- Where the business stands today
- What do analysts expect for HOOD stock over the next 12 months?
- HOOD stock forecast for 2030: three scenarios
- The bear case: growth slows sharply
- The base case: steady product expansion
- The bull case: international and private market dominance
- Risks to weigh
- What to watch next
- FAQ
Robinhood Markets (HOOD) has evolved from a meme-stock trading app into a profitable financial platform pulling in billions in annual revenue. With shares trading around $91.45 and a market value topping $82 billion, investors want to know whether the company can keep compounding or if growth will run out of room.
This forecast walks through where Robinhood’s business stands today, what Wall Street expects over the next 12 months, and three valuation scenarios for 2030. Long-range forecasts are not crystal-ball predictions; they are mathematical guideposts to help you see what kind of revenue growth and profit multiples are already baked into the current stock price.
| Share price | $91.45 (Oct 29, 2026 1:23 PM ET) |
| Market value | about $82.2 billion |
| 52-week range | $63.52 – $150.47 |
| Revenue, last 12 months | about $5.1 billion |
| Revenue growth, last fiscal year | 52% |
| Net income, last 12 months | about $2.0 billion |
| Price-to-sales | about 16.2× |
| Price-to-earnings | about 41× |
| Analyst 12-month target | average $134.61 (range $100 – $170); 20 buy, 3 hold, 0 sell |
Market data from Nasdaq as of October 29, 2026. Check current figures before making any decision.
What changed since our last update
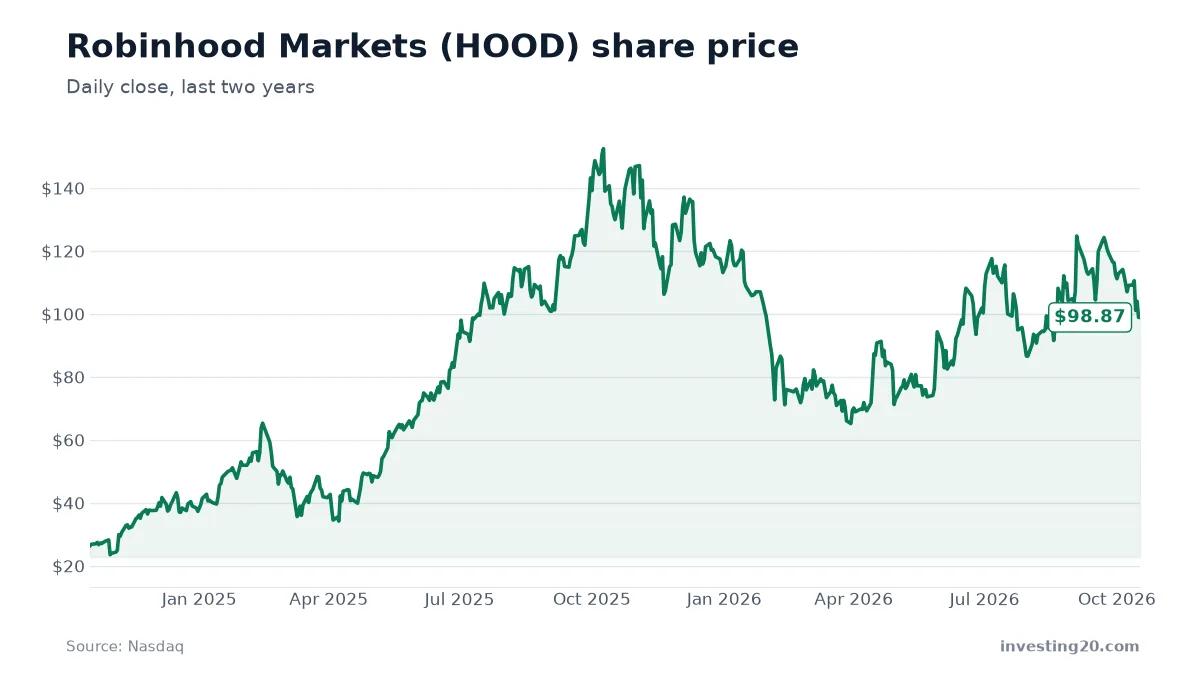
Since our October 17, 2026 update, Robinhood shares dropped 7.5% from $98.87 to $91.45, sitting well off their 52-week peak of $150.47. Wall Street’s average 12-month price target softened slightly from $138.64 to $134.61, while remaining well above current prices. Meanwhile, fresh third-quarter earnings lifted our trailing revenue base to $5.1 billion, nudging our 2030 scenario targets up across the board: the base case moved from $117.64 to $121.23, the bear case ticked from $35.90 to $36.99, and the bull case climbed from $326.03 to $332.15.
What Robinhood Markets does
Robinhood Markets runs a financial services platform built for a new generation of retail investors. While it started primarily as a commission-free stock trading app, the company has expanded into a much broader ecosystem.
The business generates income across several distinct product lines:
- Retail brokerage: Equities, options, and margin lending for self-directed retail accounts.
- Crypto trading: Direct buying, selling, and custody of digital assets, similar to the trading volumes that drive high-beta names like MARA (MARA) Stock Forecast: 2026–2030 Scenarios.
- Advisory and wealth management: Guided retirement accounts and financial planning tools designed to capture longer-term savings.
- Digital banking services: High-yield cash sweeps, debit cards, and credit services that keep customer deposits inside the Robinhood ecosystem.
- Private markets access: Offerings that allow individual retail accounts to participate in pre-IPO equity and private venture assets.
By bundling banking, trading, and custody under one digital roof, Robinhood aims to increase the average revenue it earns per user while retaining assets as its customer base matures.
Where the business stands today
Robinhood’s top-line expansion over the past three years has been steep. In fiscal 2023, the business generated $1.9 billion in revenue. That grew to $3.0 billion in fiscal 2024 and reached $4.5 billion in fiscal 2025, which amounted to a 51.6% yearly growth rate. Over the last four reported quarters ending September 30, 2026, total revenue reached $5.1 billion.
Quarterly top-line numbers show steady momentum through 2026:
- Quarter ending Dec 31, 2025: $1.28 billion
- Quarter ending Mar 31, 2026: $1.07 billion
- Quarter ending Jun 30, 2026: $1.31 billion
- Quarter ending Sep 30, 2026: $1.42 billion
Profitability has also firmed up. Over the last four quarters, net income totaled $2.0 billion, up from $1.9 billion in full-year 2025 and $1.4 billion in 2024. That leaves the stock trading at a price-to-earnings (P/E) ratio of 41.4 and a price-to-sales (P/S) multiple of 16.2.
Earnings reports over the past year have largely beaten consensus forecasts, despite occasional bumps:
- Q3 2026 (reported Oct 27, 2026): EPS came in at $0.60 against an expected $0.56, a 7.14% positive surprise.
- Q2 2026 (reported Jul 29, 2026): EPS hit $0.62 versus a consensus of $0.44, beating expectations by 40.91%.
- Q1 2026 (reported Apr 28, 2026): EPS missed, coming in at $0.38 against an expected $0.40 (a negative 5.0% surprise).
- Q4 2025 (reported Feb 10, 2026): EPS was $0.66 against an expected $0.63, a 4.76% surprise.
Looking ahead, the analyst consensus compiled by Nasdaq projects full-year 2026 EPS of $2.20 across 9 analysts, rising to $3.09 in 2027 (10 analysts) and $3.75 in 2028 (6 analysts).
What do analysts expect for HOOD stock over the next 12 months?
Wall Street sentiment leans decisively positive on Robinhood right now. Nasdaq data shows 23 analysts covering the stock: 20 rate it a buy, 3 call it a hold, and zero recommend selling.
The average 12-month price target is $134.61, which sits about 47.2% above the October 29 share price of $91.45. Even the street’s most cautious target of $100.00 sits about 9% higher than today’s price, while the high target stands at $170.00.
For Robinhood to hit that average target of $134.61 over the coming year, it would need to sustain its net income trajectory toward the consensus 2027 EPS target of $3.09. That requires retail trading volumes in equities and crypto to remain elevated, interest income on cash sweeps to hold up, and customer acquisition to stay cost-efficient. If transaction volumes drop off sharply, hitting those estimates becomes much harder.
HOOD stock forecast for 2030: three scenarios
To evaluate Robinhood’s potential five years out, we run three mathematical scenarios. We start from trailing four-quarter revenue of $5.1 billion, project revenue growth to 2030 with natural deceleration as scale increases, apply an exit price-to-sales multiple, and adjust for share count dilution.
To give you an idea of what is already priced in: at our base-case multiple (10.0x P/S) and share count (954 million shares), Robinhood would need to reach about $8.7 billion in revenue by 2030 just to justify today’s $91.45 share price.
| Scenario | Revenue growth per year | 2030 revenue | Price-to-sales | Shares | Implied share price |
|---|---|---|---|---|---|
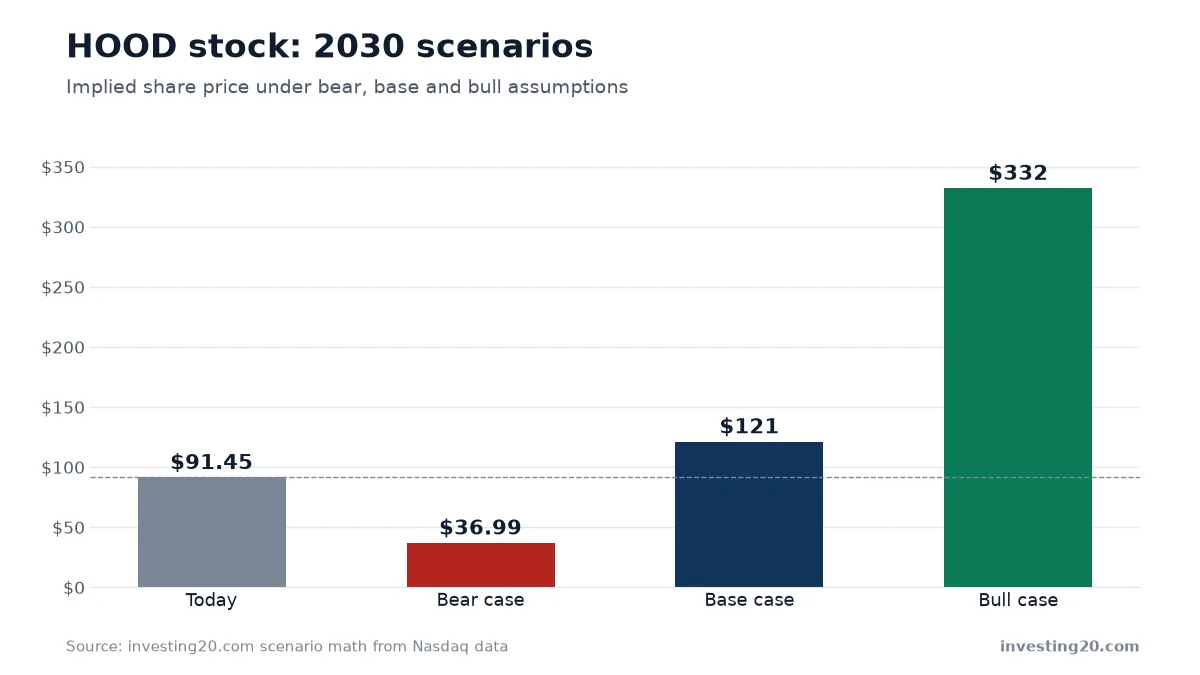
| Bear | 15% slowing to 5% | $7.5 billion | 5.0× | 1.01 billion | about $36.99 (-60%) |
| Base | 31% slowing to 15% | $11.6 billion | 10.0× | 954 million | about $121.23 (+33%) |
| Bull | 46% slowing to 25% | $17.1 billion | 17.8× | 917 million | about $332.15 (+263%) |
The bear case: growth slows sharply
In the bear scenario, revenue growth slows from 15% down to 5% per year, averaging about 10% annually. By 2030, Robinhood generates $7.5 billion in annual revenue. With slower top-line expansion, the market values HOOD more like a mature financial brokerage, compressing its price-to-sales multiple to 5.0x. Factoring in modest share dilution to 1.01 billion shares, the stock would trade around $36.99, a decline of 60% from today’s price.
The base case: steady product expansion
Our base case models revenue growth decelerating from 31% to 15% per year, averaging roughly 23% annually through 2030. Annual revenue hits $11.6 billion. The valuation multiple contracts from today’s 16.2x down to 10.0x, reflecting a larger, more established enterprise. With a share count of 954 million, this yields an implied share price of $121.23, an upside of 33% from current levels.
The bull case: international and private market dominance
In the bull scenario, Robinhood continues expanding rapidly into international markets, digital banking, and private market shares, while crypto and options trading remain strong. Revenue growth begins at 46% and tapers to 25%, averaging 35% per year to hit $17.1 billion by 2030. The market awards the company a premium 17.8x price-to-sales multiple. Assuming a share count of 917 million due to share repurchases, the implied share price reaches $332.15, representing a 263% gain.
The key takeaway from this math is that Robinhood’s current valuation of 16.2x sales already demands meaningful growth. If you buy at today’s levels, you are counting on Robinhood more than doubling its revenue base while maintaining double-digit sales multiples. You can track how these long-term valuation frameworks compare against other growth companies in our Robinhood Markets (HOOD) Stock Forecast: 2026–2030 Scenarios overview and our Tesla (TSLA) Stock Forecast: 2026–2030 Outlook.
Risks to weigh
Before making any investment decisions on Robinhood, consider these specific business and market risks:
- Reliance on market volatility: A substantial portion of Robinhood’s revenue depends on retail trading volumes in options, equities, and cryptocurrencies. Extended quiet or bear markets dry up user activity and trading fee income.
- Multiple compression risk: At 16.2x sales and a 41.4 P/E ratio, the stock trades at a large premium to traditional brokerage firms. If growth decelerates faster than projected, valuation compression could pull the stock down even if revenue continues to rise.
- Regulatory exposure: Retail financial platforms face regular scrutiny regarding payment for order flow (PFOF), margin lending practices, and crypto asset classification. Unfavorable regulatory changes could directly impact high-margin revenue streams.
- High-beta price swings: HOOD has a history of wide price swings, ranging from a low of $23.49 in late 2024 to an all-time high of $152.46 in late 2025. Investors should expect continued volatility.
What to watch next
If you are tracking Robinhood, keep an eye on three core drivers over the next few quarters:
First, monitor quarterly revenue growth against the $1.42 billion baseline set in Q3 2026. Consistent expansion across banking and advisory services will show whether Robinhood is successfully reducing its reliance on cyclical trading spikes.
Second, watch full-year EPS progress relative to the consensus target of $2.20 for 2026 and $3.09 for 2027. Meeting or beating these targets will be critical to supporting the current 41.4 earnings multiple.
Finally, keep an eye on share count dilution. As the company matures and cash flows build, whether management keeps dilution minimal will determine how much future revenue growth actually reaches each individual share.
FAQ
What is the 12-month analyst target for HOOD stock?
According to Nasdaq consensus data as of October 29, 2026, Wall Street analysts have an average 12-month target of $134.61, with estimates ranging between $100.00 and $170.00.
Is Robinhood profitable today?
Yes. Over the last four quarters leading up to September 30, 2026, Robinhood generated $2.0 billion in net income on $5.1 billion of revenue.
What is the 2030 forecast for HOOD stock?
Based on investing20.com scenario modeling, the base case estimates a 2030 share price of about $121.23, while the bear case points to $36.99 and the bull case reaches $332.15, depending on revenue growth and valuation multiples.
Market data and financials: Nasdaq. Scenario math: investing20.
This article is for information only and is not investment advice. Do your own research before investing.