Amp Price Prediction 2026–2030: Can Amp Reach $0.50?
Realistic Amp (AMP) price targets through 2030 based on market cap math, token supply releases, and crypto market share scenarios.
On this page
Amp (AMP) trades at fractions of a cent, leading many investors to wonder whether a tiny token price can translate into explosive percentage gains. Earlier coverage asked whether AMP crypto will explode, but looking ahead to 2026 through 2030 requires separating realistic market dynamics from internet hype. Longer-term predictions beyond 2030 are simply too far out to model honestly, given how fast blockchain protocols rise and fall.
Before looking at targets, remember that long-range crypto predictions are mathematical scenarios, not guaranteed forecasts. Cryptocurrencies carry structural risk, generate no underlying corporate earnings, and can lose most or all of their value during extended downturns.
| Price | $0.000713 (October 17, 2026) |
| Market value | about $64.1 million (#386 by market value) |
| Trading volume, 24 hours | about $27.9 million |
| Coins in circulation | 89.78 billion (90% of the 100 billion total) |
| Change, last 12 months | -71% |
| All-time high | $0.121 on June 16, 2021 (-99%) |
| Whole crypto market | about $2.7 trillion; Amp is 0.00% of it |
Market data from CoinGecko as of October 17, 2026. Crypto prices move fast; check current figures before making any decision.
In the past 24 hours, the price of Amp increased by 13.20%. However, over the past 7 days, despite the recent increase, Amp experienced a decline of 5.52%.
This week, Amp is showing signs of a potential reversal. Take a look at the technical analysis before reading a trend into it.
| Period | Change (USD) |
|---|---|
| Today | +13.20% |
| 7 days | -5.52% |
| 14 days | +1.13% |
| 30 days | +14.77% |
| 60 days | +64.43% |
| 200 days | -18.50% |
| 1 year | -70.70% |
Updated October 31, 2026 · Data provided by CoinGecko
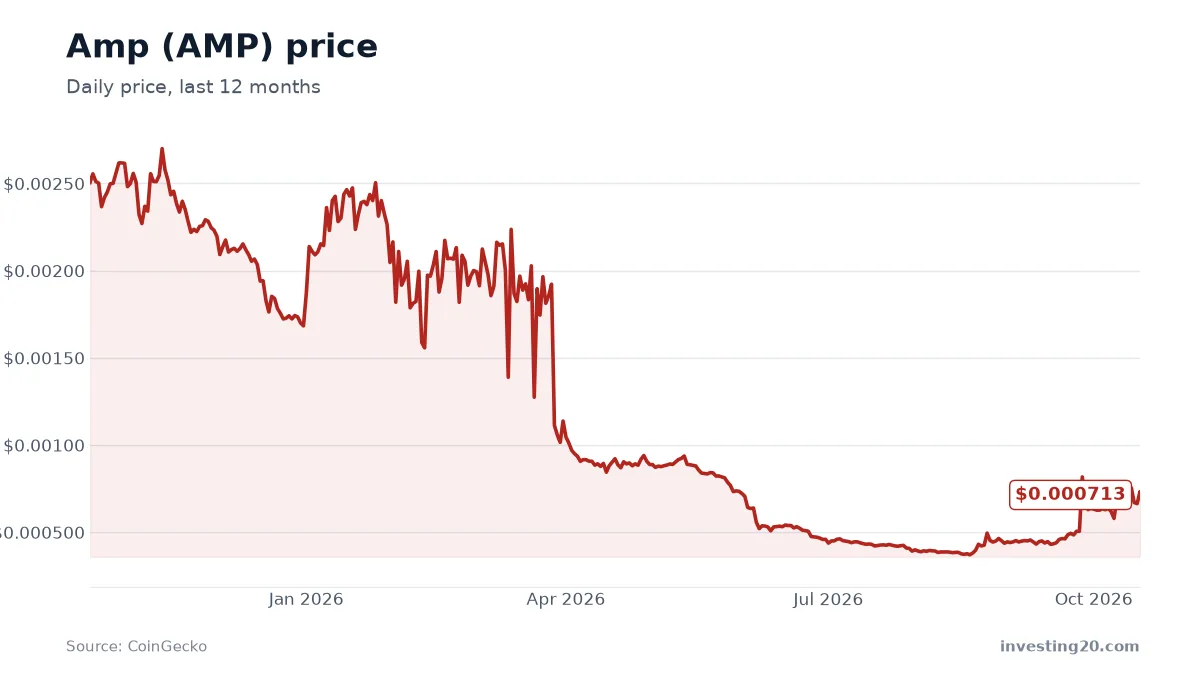
The snapshot above highlights the core challenge facing Amp. Despite a recent 30-day bounce of 62.8%, the token remains down 71.2% over the trailing 12 months. More telling is the collapse from its record peak: down 99% since the summer of 2021.
What Amp is and what the coin is used for
Amp operates as a decentralized digital collateral token designed to facilitate instant, verifiable value transfers. When you buy goods or send funds across traditional blockchains, transactions often take minutes or hours to clear. Amp solves this settlement delay by serving as a financial guarantee.
Payment networks like Flexa use Amp to secure consumer transactions at the point of sale. If a payment fails, takes too long to confirm, or encounters fraud, the deposited Amp collateral can be liquidated to cover the difference, ensuring the merchant gets paid immediately.
Technically, Amp organizes collateral through dedicated partitions and collateral managers on the Ethereum blockchain. Collateral partitions allocate pools of tokens to secure specific transactions, applications, or merchant accounts. Collateral managers are smart contracts that automatically lock, release, or reallocate these tokens without human intervention. This setup also allows users to stake tokens directly from their own wallet addresses rather than giving up custody to a third-party bridge.
Outside Ethereum, Amp links with payment rails across the Near Protocol ecosystem and fits within broad decentralized finance (DeFi) payment solutions. Major venture backers like Pantera Capital have supported the token’s ecosystem, though the asset was also labeled an alleged unregistered security in regulatory filings by the SEC.
Where the price stands today
As of October 17, 2026, Amp trades at $0.000713 with a total market capitalization of $64.1 million, ranking it #386 among digital assets. Daily trading activity sits at approximately $27.9 million, indicating steady liquidity relative to its total size.
The token has an circulating supply of 89.78 billion coins out of a total supply of 99.72 billion and a hard cap of 100 billion. Roughly 10.22 billion coins remain locked or unissued.
Amp’s current standing looks stark when viewed historically. On June 16, 2021, the token hit an all-time high of $0.121 during the peak of that cycle’s decentralized finance boom. At today’s price, Amp trades 99% below that high-water mark. Meanwhile, the broader crypto market sits at $2.7 trillion, led by Bitcoin’s $1.6 trillion valuation. Amp represents just 0.002% of the entire digital asset market. Similar market share compression has affected other payment-focused tokens, as seen in our Stellar (XLM) price prediction.
Can Amp reach $0.50?
A common question among retail buyers looking at cheap coins is whether Amp can reach milestones like $0.50 or even $0.10. To answer this honestly, you have to ignore the nominal unit price and calculate the required market value using the circulating supply.
| Price | Market value needed | Times today’s value | Share of today’s whole crypto market | Compared with Bitcoin today |
|---|---|---|---|---|
| $0.002 | $179.6 million | 2.8× | 0.0% | 0.00× Bitcoin |
| $0.005 | $448.9 million | 7.0× | 0.0% | 0.00× Bitcoin |
| $0.01 | $897.8 million | 14.0× | 0.0% | 0.00× Bitcoin |
| $0.10 | $9.0 billion | 140.1× | 0.3% | 0.01× Bitcoin |
| $0.121 (all-time high) | $10.8 billion | 169.2× | 0.4% | 0.01× Bitcoin |
Market value needed = price × today’s 89.78 billion coins in circulation; more coins in circulation would raise every figure.
The table above details the market capitalizations required to reach various price milestones based on the 89.78 billion coins circulating today.
A target like $0.002 requires a market cap of $179.6 million, which is 2.8 times today’s size and remains a tiny fraction of Bitcoin’s total footprint. Even pushing to $0.01 requires an $897.8 million valuation, representing a 14-fold jump.
A move to $0.10 requires a $9.0 billion valuation, while returning to the all-time high of $0.121 demands $10.8 billion. That would require an enormous 169.2 times expansion from current levels.
Can Amp reach $0.50? In plain terms: no. At $0.50, Amp would require a market value approaching $45 billion, roughly 700 times its current size. For context, that would equal nearly 3% of Bitcoin’s entire current valuation and exceed the scale of established layer-1 ecosystems. Without massive, global enterprise payment adoption running exclusively through Flexa, such valuations are detached from reality. We explore similar mathematical ceilings in our XRP price prediction analysis.
Amp price prediction for 2030: three scenarios
Because digital tokens have no corporate earnings, price models rely on three variables: the size of the broader crypto market, the token’s market share, and the number of coins released into circulation.
Historically, older altcoins gradually lose market share to newer protocols over time. To account for this, the baseline model assumes Amp retains 80% of its current 0.002% market share. Unissued supply also alters the math: as the remaining 10.22 billion coins enter circulation, the value of each existing coin gets diluted.
| Scenario | Whole crypto market in 2030 | AMP share of it | Coins in circulation | Implied price |
|---|---|---|---|---|
| Bear | $2.2 trillion (-5% a year) | 0.00% | 100 billion | about $0.000209 (-71%) |
| Base | $4.0 trillion (+10% a year) | 0.00% | 94.89 billion | about $0.000791 (+11%) |
| Bull | $6.7 trillion (+25% a year) | 0.00% | 92.34 billion | about $0.00254 (+256%) |
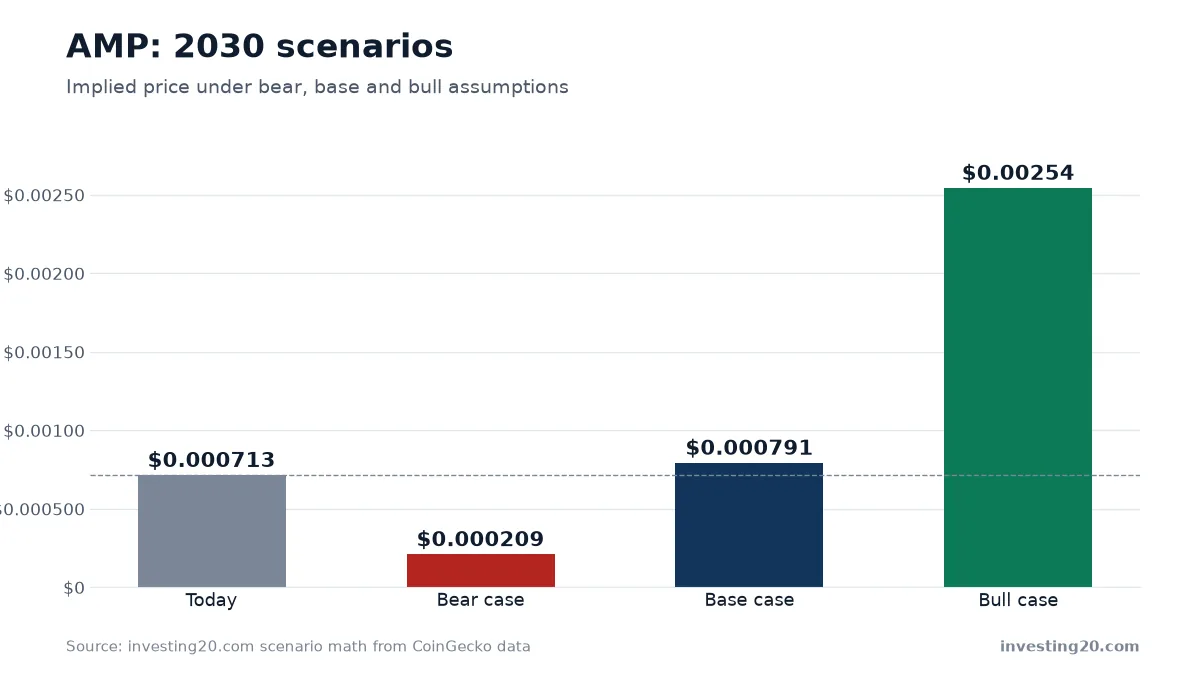
The bear scenario assumes the digital asset market contracts by 5% annually, falling to $2.2 trillion by 2030. In this environment, Amp’s market share slips to 0.001% (40% of today’s level) as payments volume slows, while all remaining unissued tokens hit the market to reach the full 100 billion supply cap. That math produces an implied price of roughly $0.000209, a decline of 71% from current levels.
The base scenario envisions steady, mature growth. If the crypto market expands at 10% per year to hit $4.0 trillion by 2030, and Amp retains 80% of its market share (holding a 0.002% slice), the price would hover near $0.000791. Even with half of the unissued tokens released to bring circulating supply to 94.89 billion, the price gains just 11% over several years, illustrating how supply inflation eats into capital appreciation.
The bull scenario models an aggressive run where the market expands by 25% annually to $6.7 trillion. If Amp expands its payment integrations and lifts its market share by 50% to 0.003%, with only a quarter of unissued coins released (92.34 billion circulating), the implied price climbs to $0.00254. That represents a 256% gain from today’s levels, yet still sits well below one cent.
The primary takeaway from these models is clear: even under highly favorable macro conditions, massive token supply limits Amp’s per-coin price potential.
Risks to weigh
Before considering an allocation to Amp, factor in these operational and market risks:
- Token dilution from supply releases: There are still 10.22 billion coins not yet in circulation. As these tokens enter the market, they increase overhead supply and dilute existing holders.
- Regulatory headwinds: The SEC previously named Amp as an alleged unregistered security, which limits listings on domestic exchanges and discourages enterprise payment integration.
- Severe long-term drawdown: Amp has dropped 71.2% over the last 12 months and remains 99% below its 2021 peak, proving that recovery is not guaranteed.
- Concentrated utility: Amp relies heavily on adoption from the Flexa network and retail crypto merchant adoption, which faces steep competition from stablecoin payment rails.
- Diminishing market share: Holding just 0.002% of the crypto market cap, Amp risks sliding further down the market rankings if liquidity concentrates in top-tier assets.
What to watch next
If you track Amp, the single most important metric is transaction volume flowing through collateral managers on the Flexa network. Real collateral utility matters far more than short-term trading spikes.
Keep an eye on the distribution schedule for the remaining 10.22 billion coins, as sudden supply additions can quickly cap price momentum. Finally, watch regulatory developments surrounding tokens previously targeted in SEC enforcement actions. For investors tracking lower-cap digital assets facing similar token-supply constraints, our look at the GALA price prediction provides a helpful comparison.
FAQ
Can Amp reach $0.50?
Reaching $0.50 is mathematically unrealistic under current conditions. With nearly 90 billion coins in circulation, a $0.50 price would demand a market value of roughly $45 billion, which far exceeds realistic collateral demand for the network.
Will Amp crypto explode back to its all-time high?
Returning to its record peak of $0.121 requires an implied market value of $10.8 billion, a 169-fold gain from current levels. While possible in an extraordinary bull market, Amp's market share has shrunk dramatically, making an explosive return unlikely in the near term.
What is the Amp price prediction for 2030?
A scenario model based on crypto industry growth projects Amp trading between $0.000209 in a bear market, $0.000791 in a baseline case, and $0.00254 in an optimistic scenario by 2030.
What is the main utility of the AMP token?
Amp serves as digital collateral on networks like Flexa, locking value in smart contracts to guarantee and settle payment transactions instantly while merchants wait for final clearance.
Market data: CoinGecko. Scenario math: investing20.
This article is for information only and is not investment advice. Do your own research before investing.