Target (TGT) Stock Forecast 2026–2030: Scenarios
Target (TGT) stock forecast for 2026 to 2030. Compare bull, base, and bear scenarios for TGT stock based on revenue growth and valuation metrics.
On this page
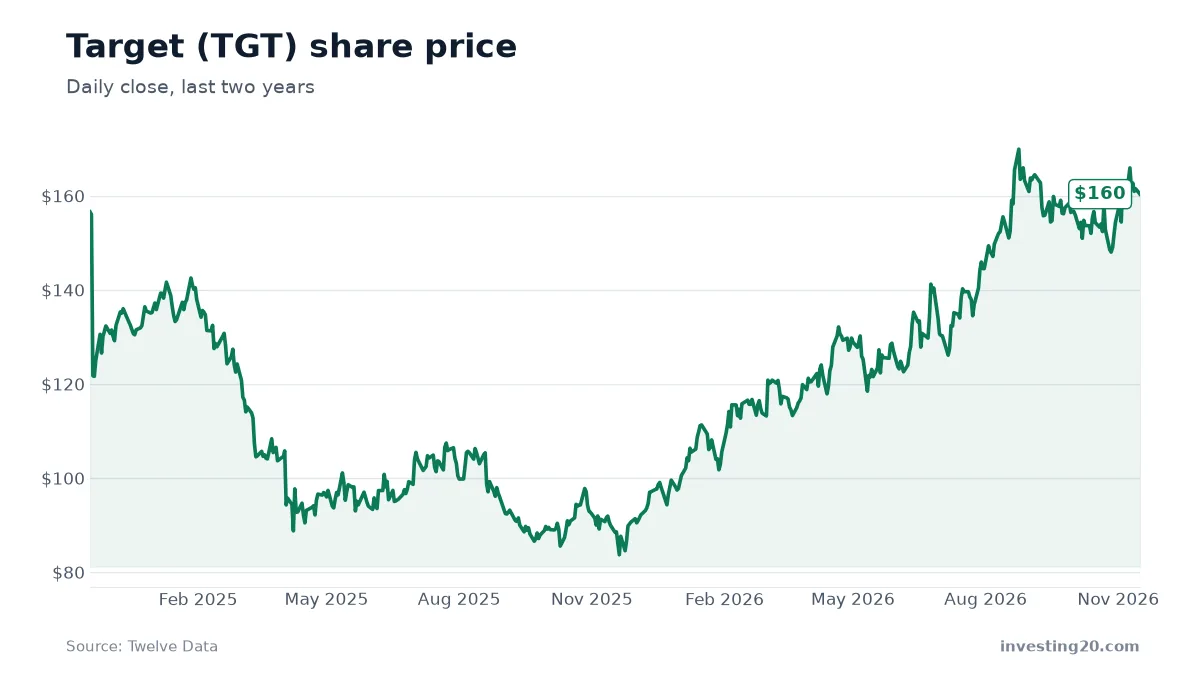
Target (TGT) trades at $160.32 as of November 16, 2026, giving the general merchandise retailer a market value of roughly $72.8 billion. If you are deciding whether to hold Target shares in your portfolio over the next several years, this article examines where the business stands today and maps out potential valuation paths through 2030.
Long-range stock forecasts are not promises or exact predictions. Instead, think of them as scenario models built on concrete assumptions about annual revenue growth, valuation multiples, and total share counts. Let’s look at the core numbers driving Target today.
| Share price | $160.32 (2026-11-16) |
| Market value | about $72.8 billion |
| 52-week range | $83.44 – $170.75 |
| Revenue, last 12 months | about $107.7 billion |
| Revenue growth, year over year | 2% |
| Net income, last 12 months | about $4.4 billion |
| Price-to-sales | about 0.7× |
| Price-to-earnings | about 17× |
Market data from Twelve Data as of November 16, 2026. Revenue and net income from the company’s SEC filings. Check current figures before making any decision.
What Target does
Target operates as a major variety store retailer in the United States, competing in the Retail-Variety Stores sector. The company sells everyday items, groceries, apparel, home goods, electronics, and seasonal products across physical retail stores and digital platforms.
The business generates revenue by selling consumer items directly to retail shoppers. It relies on a mix of high-volume essential household staples and higher-margin discretionary merchandise. Sustaining physical store visits and handling online orders efficiently are critical drivers of the company’s annual revenue.
Where the business stands
Target produced $107.7 billion in revenue over the last four reported quarters, representing a 2.0% increase compared to the same period a year earlier. Annual top-line figures show stability following slight shifts in prior years: revenue was $107.4 billion in the fiscal year ending February 3, 2024, $106.6 billion in the fiscal year ending February 1, 2025, and $104.8 billion in the fiscal year ending January 31, 2026.
Quarterly sales numbers over the past year demonstrate consistent operational scale:
- Quarter ending August 1, 2026: $26.54 billion
- Quarter ending May 2, 2026: $25.44 billion
- Quarter ending January 31, 2026: $30.45 billion
- Quarter ending November 1, 2025: $25.27 billion
Profits have expanded alongside sales. Target recorded $4.4 billion in net income over the last four reported quarters. That compares to $3.7 billion for the fiscal year ending January 31, 2026, and $4.1 billion for the fiscal year ending February 1, 2025.
As of November 16, 2026, Target stock trades at a price-to-earnings (P/E) ratio of 16.6 and a price-to-sales (P/S) ratio of 0.7. For context on how mature retail models compare against digital or consumer tech platforms, look at how investors evaluate established giants like Apple (AAPL) or financial apps like Robinhood Markets (HOOD). Target offers an income-oriented retail footprint tied closely to everyday American retail spending.
TGT stock forecast for the next 12 months
Over the next 12 months, Target’s stock price trajectory will depend on whether sales can build on recent gains while keeping operating costs steady. Over the past 52 weeks, TGT shares have traded between $83.44 and $170.75. Looking back further, the stock stood at $156.56 on November 18, 2024, representing a modest 2.4% gain over a two-year period. On August 24, 2026, shares hit a high of $169.89, after reaching a low of $83.68 on November 20, 2025.
What would need to happen over the next year? For shares to push toward the upper end of their recent range, Target needs to show that its recent 2.0% revenue growth pace is sustainable or accelerating. Because retail operates on narrow profit margins, managing inventory levels, labor costs, and freight expenses will directly dictate whether quarterly net income stays on an upward trajectory.
Target stock forecast 2030: three scenarios
To build a tgt stock price forecast for 2030, we start from the $107.7 billion in revenue generated over the last four reported quarters, apply annual growth rates, set a valuation multiple, and factor in potential share count changes.
At today’s price-to-sales ratio of 0.7, Target needs to generate roughly $107.7 billion in revenue in 2030 at the base share count just to support its current $160.32 price. In plain terms, today’s stock price already assumes the company maintains its current revenue baseline.
| Scenario | Revenue growth per year | 2030 revenue | Price-to-sales | Shares | Implied share price |
|---|---|---|---|---|---|
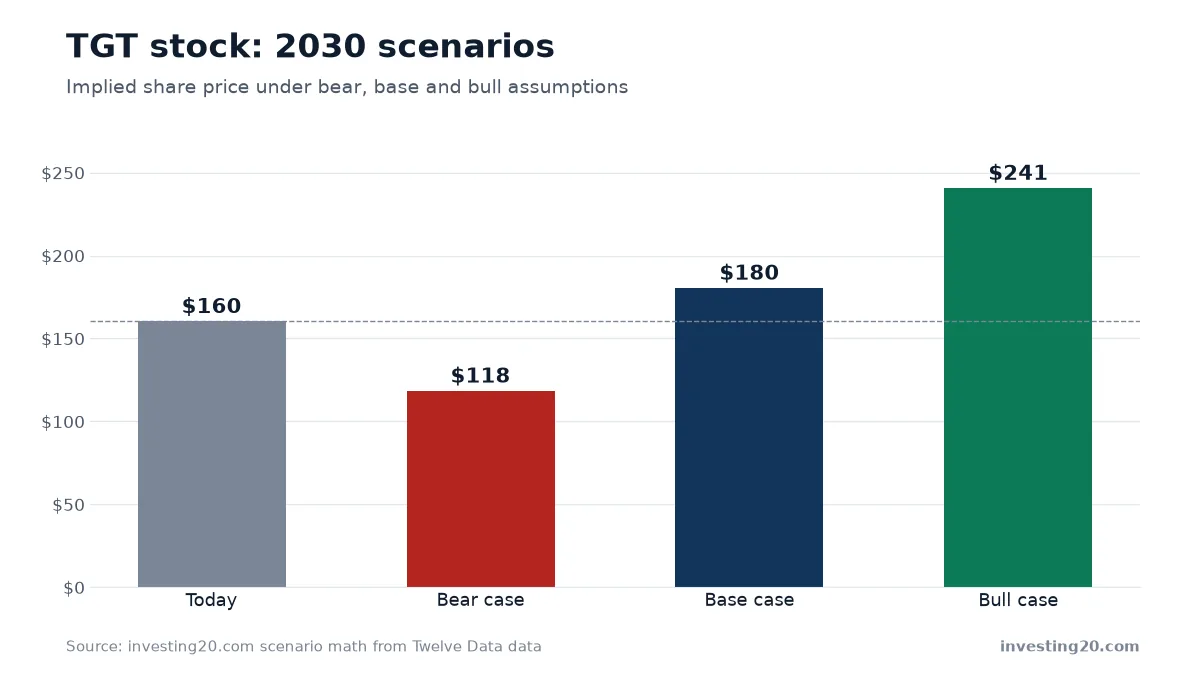
| Bear | -1% | $103.5 billion | 0.5× | 473 million | about $118.39 (-26%) |
| Base | 3% | $121.2 billion | 0.7× | 454 million | about $180.44 (+13%) |
| Bull | 7% | $141.2 billion | 0.7× | 436 million | about $240.64 (+50%) |
Bear case
In the bear scenario, persistent inflation or tougher retail competition pulls annual sales down by about 1% a year on average. By 2030, revenue declines to $103.5 billion. If market sentiment softens and the price-to-sales multiple compresses to 0.5x, with share dilution pushing the count to 473 million shares, the implied price drops to about $118.39. That would mark a 26% drop from today’s $160.32 level.
Base case
The base case assumes Target delivers steady 3% annual revenue growth as general consumer spending holds up. Under this path, revenue reaches $121.2 billion in 2030. Assuming the price-to-sales multiple stays at today’s 0.7x level and ongoing share buybacks trim the total count to 454 million shares, the implied stock price reaches about $180.44—a 13% gain from current prices.
Bull case
The bull case models a scenario where strong foot traffic and digital momentum push revenue growth to 7% a year on average, lifting 2030 revenue to $141.2 billion. Holding the price-to-sales multiple at 0.7x and assuming share repurchases reduce the count to 436 million shares yields an implied share price of about $240.64. That represents a 50% increase for long-term investors.
Investors evaluating physical store operators alongside international commerce platforms like Jumia (JMIA) can use these revenue and valuation benchmarks to compare traditional store cash flows against higher-growth global plays.
Risks to weigh
Before making any investment choices based on tgt stock predictions, keep these key business and valuation risks in mind:
- Discretionary spending cuts: When household budgets tighten, shoppers trim purchases of clothing, home decor, and electronics, which carry higher profit margins than store groceries.
- Cost pressures: Inflation in warehouse operations, employee wages, or store freight costs can squeeze net margins even if total revenue stays flat.
- E-commerce competition: Online competitors and discount retailers continually fight for market share, forcing store operators to spend on digital fulfillment and promotions.
- Multiple contraction: If annual sales growth stalls, the market could lower the price-to-sales multiple assigned to TGT stock, dragging down share value even if underlying revenue remains stable.
What to watch next
To see whether Target is tracking toward its base or bull scenario over the coming quarters, monitor these key signals:
- Quarterly revenue trends: Check upcoming 10-Q filings to see if top-line growth holds above or falls below the recent 2.0% pace.
- Profit margin stability: Watch whether four-quarter net income moves higher than the current $4.4 billion level.
- Inventory and expense controls: Pay attention to operating costs and inventory management to verify that store sales convert cleanly into net income.
FAQ
What is the tgt stock forecast for 2030?
Under a base-case scenario assuming 3% average annual revenue growth and a stable 0.7x price-to-sales ratio, Target stock points to an implied price of about $180.44 by 2030. The bull case outlines $240.64, while the bear case indicates $118.39.
What is the target stock price target?
Long-term scenario modeling suggests an implied stock price range of $118.39 to $240.64 by 2030. As of November 16, 2026, Target stock trades at $160.32.
What is the target stock price forecast for the long term?
Today's valuation of 0.7x price-to-sales implies the current $160.32 share price already assumes Target reaches about $107.7 billion in 2030 revenue. Sustained sales growth above 2.0% is required for long-term upside.
Market data: Twelve Data. Financials: SEC filings. Scenario math: investing20.
This article is for information only and is not investment advice. Do your own research before investing.