Circle Internet Group (CRCL) Stock Forecast 2026–2030
Circle Internet Group (CRCL) stock forecast through 2030. See Wall Street price targets, business fundamentals, and modeled bull, base, and bear valuation scenarios.
On this page
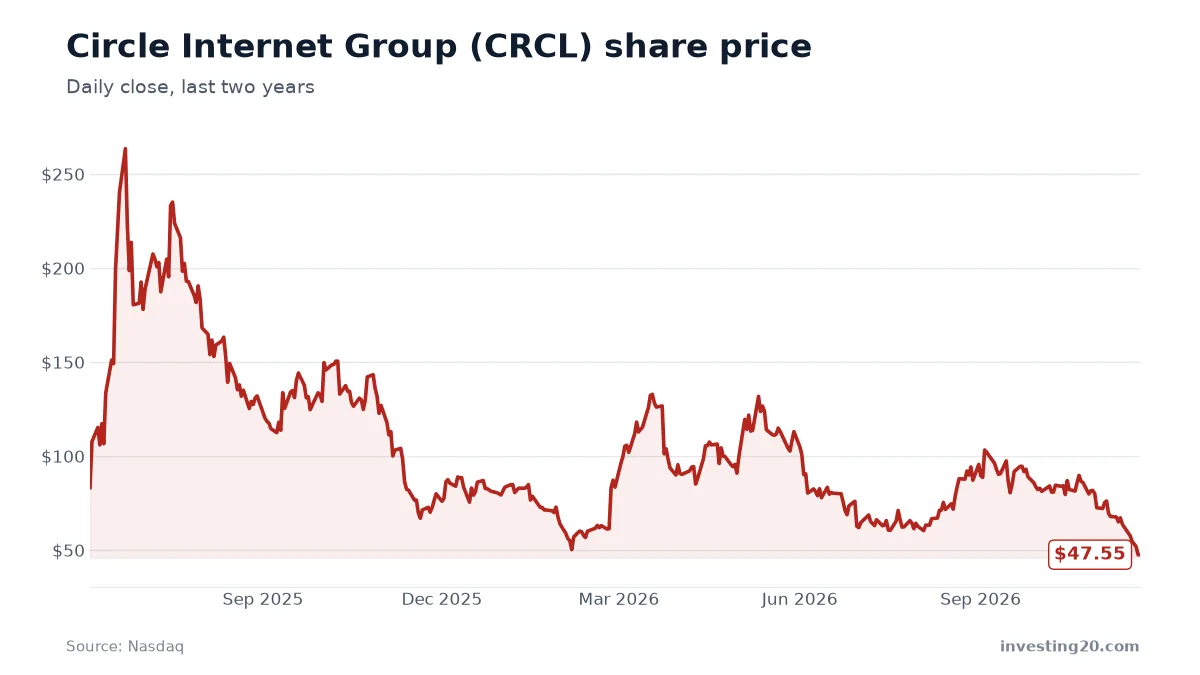
Circle Internet Group (CRCL) trades near its 52-week lows after a sharp pullback from its 2025 highs, but its underlying business continues to generate growing revenue and positive net income. This article breaks down where the business stands today, what Wall Street analysts expect over the next 12 months, and how different revenue growth paths could shape Circle’s valuation through 2030.
Long-range stock forecasts are not certain predictions. Nobody knows where interest rates, crypto market adoption, or broader equity markets will sit four years from now. Instead, the multi-year projections here are structured scenarios designed to help you see what kind of growth Circle must deliver to justify today’s valuation.
| Share price | $47.55 (Nov 20, 2026) |
| Market value | about $12.2 billion |
| 52-week range | $49.90 – $140.00 |
| Revenue, last 12 months | about $3.0 billion |
| Revenue growth, last fiscal year | 64% |
| Net income, last 12 months | about $462.9 million |
| Price-to-sales | about 4.0× |
| Price-to-earnings | about 26× |
| Analyst 12-month target | average $105.00 (range $34 – $243); 11 buy, 4 hold, 3 sell |
Market data from Nasdaq as of November 21, 2026. Check current figures before making any decision.
The table above summarizes Circle’s core market data from Nasdaq as of late November 2026. The stock sits at $47.55, giving the company a market value of roughly $12.2 billion. While the shares have fallen roughly 43% from their June 2025 level of $83.23 and sit far below their peak of $263.45 reached that same month, trailing 12-month revenue has reached $3.0 billion with profitable net income.
What Circle Internet Group does
Circle Internet Group is an internet financial platform company focused on programmable blockchain infrastructure, digital assets, and payment software. Listed on the New York Stock Exchange under the ticker CRCL, the company operates within the consumer finance sector.
Its foundation centers on three core products:
- USDC: The platform runs the USDC stablecoin network, which serves as a dollar-pegged digital asset used across decentralized finance, cross-border payments, and retail platforms.
- Circle Payments Network: A payments infrastructure layer designed to handle global money movement and settlement between traditional fiat bank accounts and digital currencies.
- Arc: An enterprise blockchain built to operate as an economic operating system for web-native financial activity.
Circle earns money primarily through transaction and platform fees, reserve management yields on the assets backing USDC, and enterprise tooling for institutions and software developers building payment applications. Its client base spans financial institutions, commercial enterprises, and software developers who require internet-scale financial settlement. Similar to trends seen in our Robinhood Markets (HOOD) Stock Forecast, Circle sits at the intersection of traditional financial services and digital asset rails.
Where the business stands: revenue and earnings
Circle’s top-line revenue has expanded rapidly over the past three fiscal years. Revenue climbed from $1.5 billion in fiscal 2023 to $1.7 billion in fiscal 2024, and then surged 63.9% to reach $2.7 billion in fiscal 2025. Over the trailing four quarters reported through September 30, 2026, total revenue reached $3.0 billion.
Quarterly revenue performance throughout 2026 highlights this upward trajectory:
- Quarter ending December 31, 2025: $770.23 million
- Quarter ending March 31, 2026: $694.13 million
- Quarter ending June 30, 2026: $701.32 million
- Quarter ending September 30, 2026: $864.89 million
The business has also moved back into profitability. Circle posted a net loss of $69.5 million in fiscal 2025 after earning $155.7 million in fiscal 2024. Over the last four reported quarters, however, net income reached positive $462.9 million.
Earnings per share (EPS) have consistently beaten Wall Street consensus estimates over the past year. In the quarter ending December 2025, Circle reported EPS of $0.43 against an expected $0.15, good for a 186.7% surprise. In March 2026, reported EPS was $0.21 versus a $0.15 forecast (a 40% surprise). June 2026 delivered EPS of $0.18 against a $0.16 estimate (a 12.5% surprise). Most recently, in the quarter ending September 2026, reported on November 4, EPS came in at $0.84 against an expected $0.42, a 100% upside surprise.
Consensus analyst forecasts compiled by Nasdaq project fiscal year 2026 EPS of $1.24 across 9 analysts. For fiscal year 2027, expectations call for $1.34 per share, followed by $1.91 per share in fiscal 2028 based on 6 analysts.
CRCL stock forecast for the next 12 months
Wall Street analysts track Circle closely, and the consensus outlook reflects significant optimism over a 12-month horizon. Among 18 analysts covering the stock according to Nasdaq data, 11 rate it a buy, 4 rate it a hold, and 3 rate it a sell.
The average 12-month price target sits at $105.00, which represents a 120.8% gain from the recent $47.55 share price. Estimates remain wide, however, ranging from a low target of $34.00 to a street-high target of $243.00.
For the stock to push toward that average target of $105.00 over the next year, Circle would likely need to maintain its recent pace of quarterly earnings beats and show that USDC circulation and transaction volumes are expanding steadily. The low target of $34.00 reflects the opposite concern: if digital payment volumes cool, interest yields on reserve assets drop, or fee compression sets in, the stock’s valuation multiple could compress further.
Investors monitoring digital asset infrastructure may also follow how other crypto-linked platforms handle these market shifts, such as the trends discussed in our Hut 8 Corp. (HUT) Stock Forecast.
CRCL stock forecast for 2030: three scenarios
To look further out, we use a basic valuation model based on revenue growth, future price-to-sales multiples, and potential share dilution. The model starts from trailing 12-month revenue of $3.0 billion. Because companies rarely sustain hyper-growth indefinitely as their base expands, each scenario assumes growth slows over time.
Today, Circle trades at roughly 4.0 times sales and 26.4 times trailing earnings. The model assumes future price-to-sales ratios will normalize toward mature company benchmarks rather than assuming current multiples persist.
| Scenario | Revenue growth per year | 2030 revenue | Price-to-sales | Shares | Implied share price |
|---|---|---|---|---|---|
| Bear | 19% slowing to 5% | $4.8 billion | 2.4× | 289 million | about $39.82 (-16%) |
| Base | 38% slowing to 15% | $7.7 billion | 3.6× | 272 million | about $102.79 (+116%) |
| Bull | 57% slowing to 25% | $11.9 billion | 4.4× | 262 million | about $201.02 (+323%) |
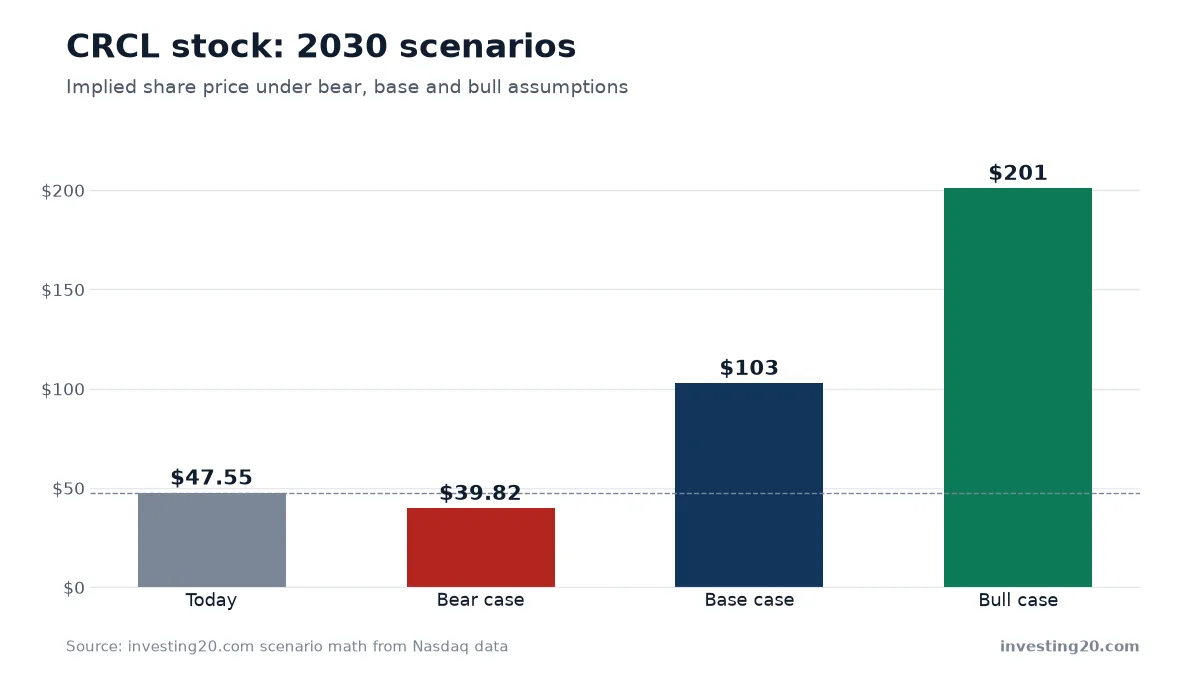
The table above outlines three distinct paths for Circle through 2030:
In the bear case, Circle’s annual revenue growth drops sharply from 19% down to 5%, averaging roughly 12% per year. Top-line revenue reaches $4.8 billion in 2030. If competition intensifies and multiple compression lowers the price-to-sales ratio to 2.4 across 289 million diluted shares, the implied stock price sits at $39.82. That represents a 16% decline from today’s price.
In the base case, revenue growth starts at 38% and moderates to 15%, delivering an average compound growth rate of roughly 26% per year. This takes 2030 revenue to $7.7 billion. Pairing that revenue with a 3.6 price-to-sales ratio and 272 million shares produces an implied share price of $102.79, a gain of 116% from current levels.
In the bull case, Circle maintains strong momentum. Growth begins at 57% and slows to 25%, averaging roughly 41% per year to hit $11.9 billion in 2030 revenue. With a price-to-sales multiple of 4.4 and modest share dilution to 262 million shares, the implied price reaches $201.02, up 323%.
The main takeaway here centers on Circle’s break-even math. At the base-case multiple of 3.6 and a share count of 272 million, Circle needs approximately $3.6 billion in revenue by 2030 to justify today’s $47.55 price. Because the company generated $3.0 billion over the past four quarters, today’s stock price reflects fairly modest long-term revenue growth expectations.
Examining valuation assumptions across emerging growth sectors is a useful exercise for any portfolio, whether evaluating digital finance or high-growth aerospace firms like those in our Rocket Lab (RKLB) Stock Forecast.
Risks to weigh
Before making any investment decisions on Circle, keep these specific operational and market risks in mind:
- Interest rate exposure on cash reserves: A meaningful portion of stablecoin platform revenue historically depends on short-term yields earned on reserve assets backing USDC. Substantial cuts to central bank interest rates can lower income from these holdings.
- Regulatory developments: Payment stablecoins and enterprise blockchains face shifting global regulation. New compliance requirements or licensing rules in major financial markets could raise operating costs or limit expansion.
- Competition from traditional and decentralized rails: Major global banks, payment card networks, and rival stablecoin issuers compete directly for settlement volume and corporate treasury adoption.
- Platform adoption risks: The growth of the Arc enterprise blockchain and Circle Payments Network depends on active developer adoption and institutional sign-ups. If large enterprise partners build proprietary systems instead, top-line growth could decelerate toward our bear scenario.
- Market volatility: As demonstrated by the stock’s slide from $263.45 in mid-2025 down to recent lows near $47.50, sentiment around digital financial assets can swing violently regardless of underlying quarterly profitability.
What to watch next
If you are tracking Circle Internet Group, the most important near-term metrics are quarterly USDC circulation figures and reserve income trends. Watch whether the company can maintain its positive operating margin as analyst consensus calls for $1.24 in full-year 2026 EPS and $1.34 in 2027. Comparing quarterly revenue run-rates against the $3.6 billion long-term break-even baseline will show whether Circle is tracking closer to its base or bear trajectory.
FAQ
What is the 12-month analyst target for CRCL stock?
Nasdaq consensus data shows an average 12-month price target of $105.00, with a low estimate of $34.00 and a high of $243.00. That average implies upside of roughly 121% from the recent price of $47.55.
Is Circle Internet Group profitable?
Yes. Circle earned $462.9 million in net income over its last four reported quarters, recovering from a net loss of $69.5 million in fiscal year 2025.
What revenue does Circle need to support its stock price in 2030?
Under our base-case valuation assumptions of a 3.6 price-to-sales multiple and 272 million diluted shares, Circle would need roughly $3.6 billion in revenue by 2030 to justify its current price of $47.55.
Market data: Nasdaq. Financials: Nasdaq. Scenario math: investing20.
This article is for information only and is not investment advice. Do your own research before investing.