Applied Digital (APLD) Stock Forecast 2026–2030: Long-Term Outlook
See the Applied Digital (APLD) stock forecast for 2026–2030. We examine analyst price targets, revenue growth scenarios, and net loss risks.
On this page
Applied Digital Corporation has drawn heavy interest from growth investors looking for exposure to modern computing infrastructure. This long-term stock forecast reviews where the business stands today and projects where the stock could trade between 2026 and 2030 under three practical revenue scenarios.
Long-range stock forecasts are not guaranteed price predictions. They are scenario-based models designed to help you evaluate potential risks and returns by connecting future operating performance to stock market valuations.
| Share price | $15.74 (Nov 6, 2026 3:13 PM ET) |
| Market value | about $4.8 billion |
| 52-week range | $13.12 – $50.73 |
| Revenue, last 12 months | about $872.3 million |
| Revenue growth, last fiscal year | 167% |
| Net income, last 12 months | a loss of about $351.5 million |
| Price-to-sales | about 5.5× |
| Price-to-earnings | n/a (not profitable) |
| Analyst 12-month target | average $53.00 (range $22 – $83); 8 buy, 2 hold, 0 sell |
Market data from Nasdaq as of November 6, 2026. Check current figures before making any decision.
What Applied Digital does
Applied Digital Corporation (NASDAQ: APLD) operates in the technology sector, focusing on EDP services and specialized infrastructure designed to power high-performance computing workloads. The business provides digital hosting and platform services tailored for technology clients managing demanding data needs.
Revenue is generated through commercial contracts for compute capacity and hosting services. As demand for scalable infrastructure has grown, Applied Digital has expanded its customer agreements, converting capacity access into top-line operating revenue.
Where the business stands today
Applied Digital has experienced massive top-line expansion alongside substantial ongoing net losses. Data from corporate reports shows revenue rising from $165.6 million in the fiscal year ending May 31, 2024, to $228.6 million in 2025, and hitting $611.3 million in the fiscal year ending May 31, 2026. That represents a 167.5% year-over-year revenue increase for its latest full fiscal year.
Over the trailing four reported quarters through August 31, 2026, total revenue reached $872.3 million. Quarter-by-quarter numbers show steady expansion:
- Quarter ending November 30, 2025: $109.87 million
- Quarter ending February 28, 2026: $161.76 million
- Quarter ending May 31, 2026: $258.75 million
- Quarter ending August 31, 2026: $341.88 million
However, bottom-line profitability remains a hurdle. Over the past four quarters, Applied Digital generated a cumulative net loss of $351.5 million. Losses totaled $231.1 million in fiscal 2025 and $184.3 million in fiscal 2026.
Quarterly earnings per share (EPS) have consistently missed consensus estimates. In the quarter ending August 31, 2026, reported on October 7, 2026, the company posted an EPS loss of $-0.76 against an expected $-0.26 loss. That followed a $-0.39 loss versus $-0.18 expected for the quarter ending May 2026, and a $-0.36 loss versus $-0.10 expected in February 2026. Analyst consensus estimates project ongoing EPS deficits through fiscal 2029, with forecasts of $-2.17 for fiscal 2027, $-1.99 for fiscal 2028, and $-1.55 for fiscal 2029.
Like hardware-heavy growth names covered in our Super Micro Computer (SMCI) stock forecast and software platforms detailed in the SoundHound AI (SOUN) stock forecast, rapid revenue growth must eventually pair with controlled operating spending to deliver durable long-term value.
APLD stock forecast for the next 12 months
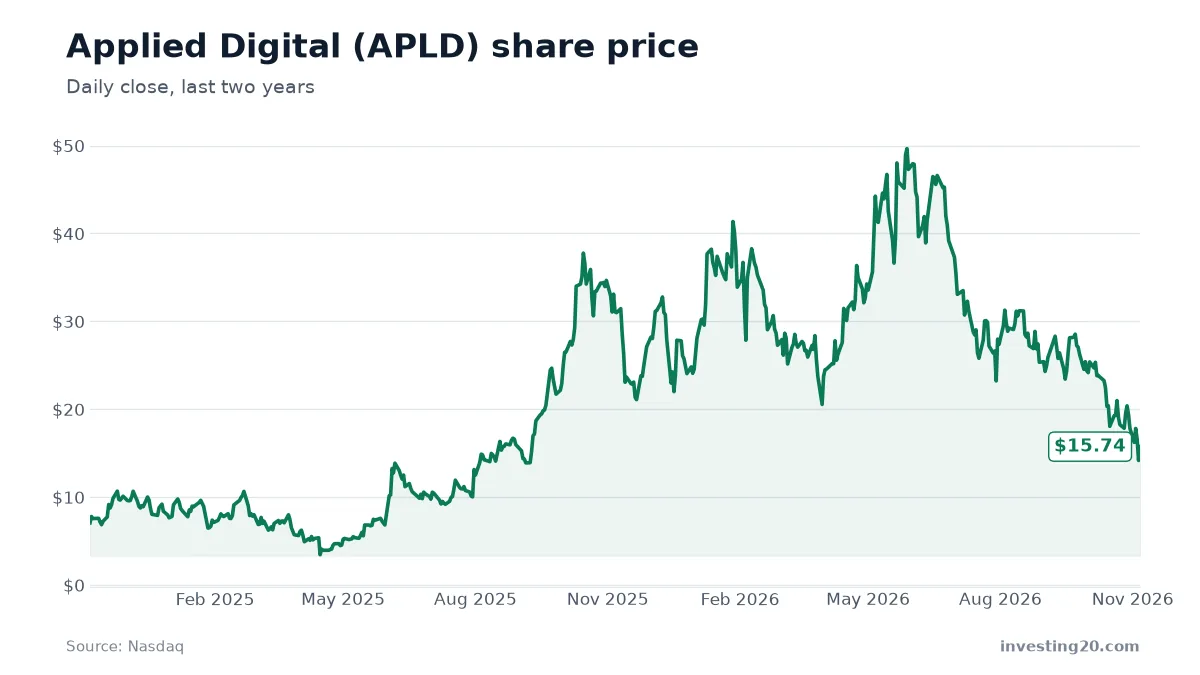
As of November 6, 2026, APLD trades at $15.74 per share, giving the business a market value of roughly $4.8 billion. Over the prior 52 weeks, the share price has ranged between $13.12 and $50.73. Today’s valuation puts the price-to-sales ratio at about 5.5 based on trailing 12-month revenue.
Wall Street analysts maintain a bullish 12-month target price outlook on the stock. Nasdaq consensus data shows 10 covering analysts, with 8 recommending a buy, 2 rating it a hold, and 0 issuing a sell rating. The average 12-month APLD price target is $53.00, representing a potential 236.7% move higher from today’s price. Analyst price targets range from a low target of $22.00 to a high target of $83.00.
For APLD stock to track toward those target levels over the coming year, the company will likely need to maintain its rapid quarterly revenue expansion while showing clear progress toward curbing its per-share earnings misses.
Applied Digital stock price prediction for 2030: three scenarios
Looking out to 2030 requires considering how revenue growth rates slow as total sales scale, alongside potential equity dilution as the company funds its operations. Investing20 built three distinct 2030 valuation scenarios starting from today’s $872.3 million trailing revenue baseline.
At today’s $15.74 share price and 5.5 price-to-sales multiple, the market is pricing in a baseline break-even mark of roughly $1.0 billion in 2030 annual revenue. If total sales hit that level while valuation multiples stay intact, the stock would hold near its current market value.
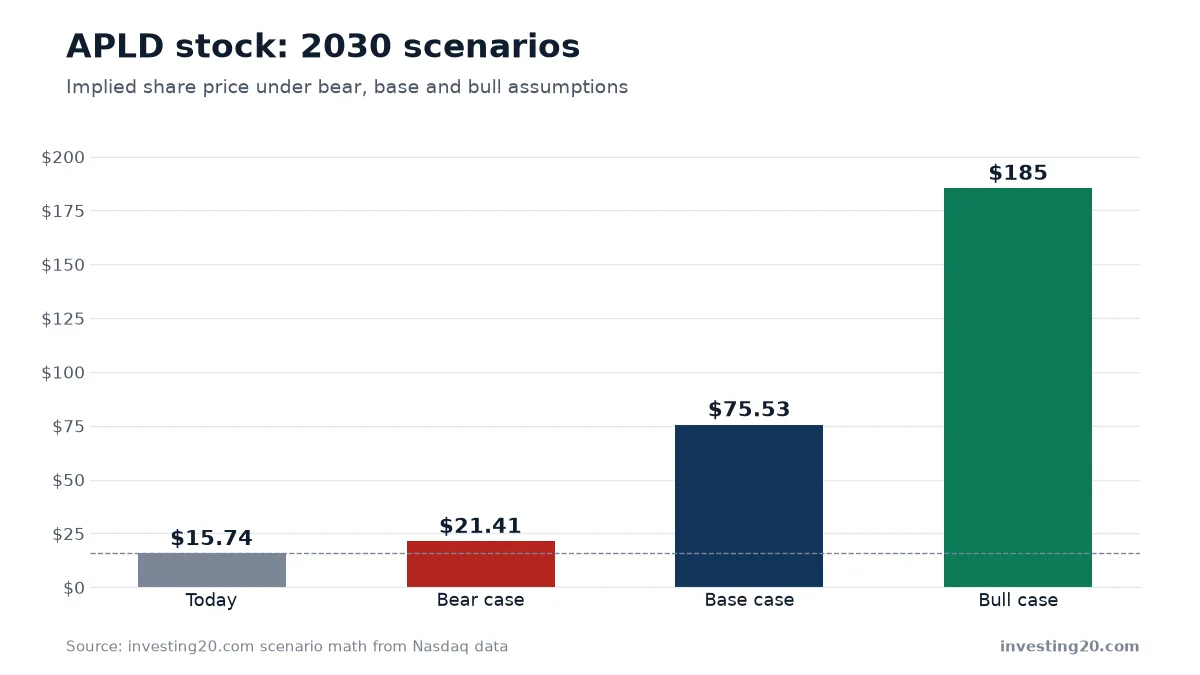
| Scenario | Revenue growth per year | 2030 revenue | Price-to-sales | Shares | Implied share price |
|---|---|---|---|---|---|
| Bear | 50% slowing to 5% | $2.2 billion | 3.3× | 340 million | about $21.41 (+36%) |
| Base | 100% slowing to 15% | $4.9 billion | 4.9× | 321 million | about $75.53 (+380%) |
| Bull | 151% slowing to 25% | $9.5 billion | 6.0× | 308 million | about $185.36 (+1,078%) |
Bear case
In the bear case, annual revenue growth slows quickly from 50% to 5% by 2030 (an average annual growth rate of roughly 26%). Revenue reaches $2.2 billion in 2030. Assuming ongoing share issuances push the total count to 340 million shares and the price-to-sales multiple contracts to 3.3, the implied share price reaches $21.41, up about 36% from current levels.
Base case
In the base case, revenue growth starts at 100% and tapers to 15% annually (averaging around 54% per year). Total 2030 revenue reaches $4.9 billion. With the share count expanding moderately to 321 million shares and a price-to-sales multiple of 4.9, the implied share price reaches $75.53. That translates to a potential gain of 380% from today’s $15.74 level.
Bull case
In the bull case, top-line growth opens at 151% before settling at 25% annually (an 82% average annual rate), taking 2030 revenue to $9.5 billion. If share count growth is limited to 308 million shares and the price-to-sales multiple expands slightly to 6.0, the implied stock price reaches $185.36, representing a potential return of 1,078%.
Investors tracking other fast-growing technology infrastructure profiles can compare these projection dynamics against our Hut 8 Corp. (HUT) stock forecast or our long-term Tesla (TSLA) stock forecast.
Risks to weigh before investing
- Persistent net losses: Applied Digital generated a net loss of $351.5 million over the past four reported quarters, and analyst forecasts expect negative earnings per share to continue through at least fiscal 2029.
- Earnings surprises to the downside: The company missed Wall Street EPS consensus estimates in all four recent quarters, including a -192.31% surprise in October 2026.
- Dilution risk: Funding ongoing cash deficits and infrastructure projects may require issuing additional stock, which dilutes existing shareholders over time.
- High stock volatility: APLD shares traded between $13.12 and $50.73 over the last 52 weeks, illustrating how quickly market sentiment can shift for high-growth tech stocks.
What to watch next
If you are following Applied Digital, focus on the upcoming quarterly earnings releases. Key indicators to track include whether quarterly revenue growth keeps pace with the double-digit trajectory and whether operating expenses begin to stabilize to narrow quarterly net losses.
You should also monitor analyst target updates and share count growth in corporate filings. Tracking how cash burn affects total outstanding shares will give you a clear view of whether future revenue gains will translate into per-share value for retail investors.
FAQ
What is the 12-month APLD price target?
According to Nasdaq consensus data, analysts have an average 12-month APLD target price of $53.00 for Applied Digital. The range spans from a low of $22.00 to a high of $83.00 across 10 covering analysts.
What is the long-term Applied Digital stock price prediction for 2030?
Based on investing20.com scenario modeling, Applied Digital's stock could reach about $21.41 in a bear case, $75.53 in a base case, or $185.36 in a bull case by 2030, depending on revenue trajectory and share dilution.
Is Applied Digital profitable?
No, Applied Digital operates at a net loss. Over the trailing four quarters ending August 31, 2026, the company posted a net loss of $351.5 million while generating $872.3 million in revenue.
Market data: Nasdaq. Financials: Nasdaq. Scenario math: investing20.
This article is for information only and is not investment advice. Do your own research before investing.