Arm plc ADR (ARM) Stock Forecast 2026–2030: Long-Term Scenarios
An ARM stock forecast for 2026 through 2030. Examine revenue trends, valuation multiples, and long-term price target scenarios.
On this page
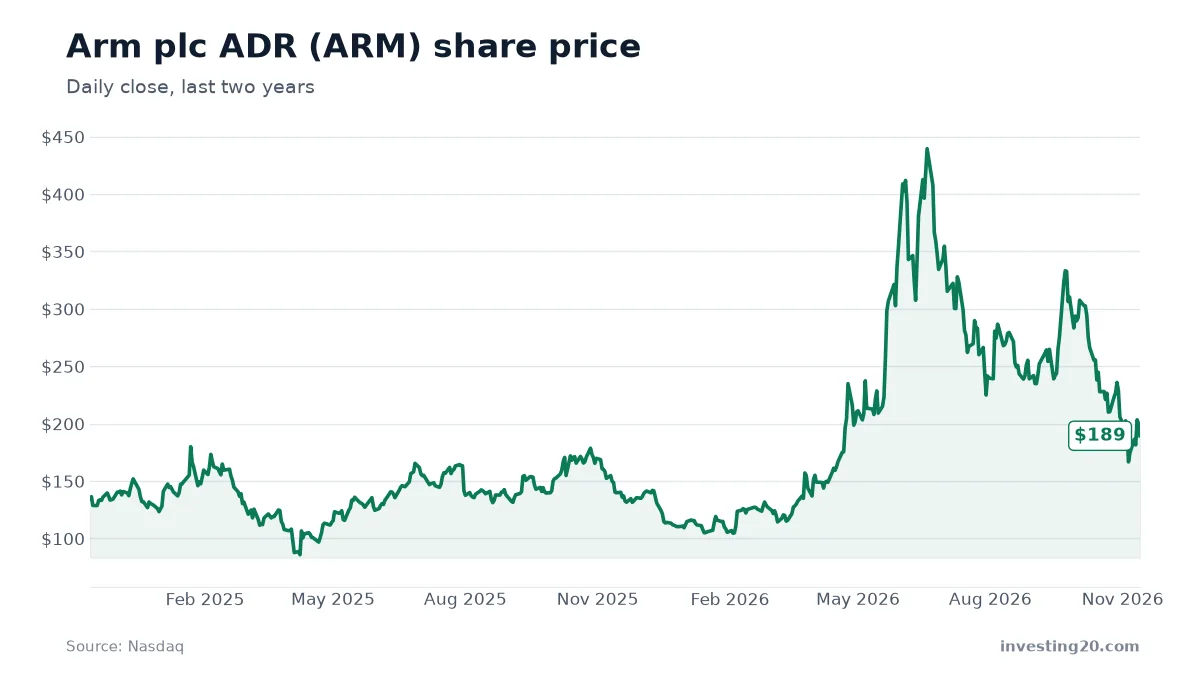
Arm Holdings plc ADR (ARM) trades around $189.44 with a market value of $202.7 billion. Its market standing rests on a central position in the tech economy: almost every smartphone on Earth, and an increasing share of cloud data centers, runs on processor blueprints designed by Arm.
Looking out several years requires setting clear expectations. An arm stock forecast is not a rigid prediction, but a set of structured scenarios based on revenue growth, valuation multiples, and share count dilution. Here is how the business operates today and where the stock could head through 2030.
| Share price | $189.44 (2026-11-13) |
| Market value | about $202.7 billion |
| 52-week range | $100.02 – $452.70 |
| Revenue, last 12 months | about $5.5 billion |
| Revenue growth, year over year | 24% |
| Net income, last 12 months | about $936.0 million |
| Price-to-sales | about 37.1× |
| Price-to-earnings | about 217× |
Market data from Twelve Data as of November 13, 2026. Revenue and net income from the company’s SEC filings. Check current figures before making any decision.
What Arm Holdings actually does
Unlike traditional semiconductor companies like Advanced Micro Devices (AMD), Arm does not manufacture or sell physical silicon chips. Instead, it creates the fundamental computing architecture and intellectual property that power modern microprocessors. It then licenses these building blocks to third-party chip designers, device manufacturers, and cloud providers.
The company’s income rests on two core revenue streams:
- Upfront licensing fees: Clients pay to gain access to Arm’s flexible architecture designs and design tools.
- Royalty fees: Clients pay a percentage or fixed fee on every individual chip shipped containing Arm technology.
When customers transition to newer standards, such as the Armv9 architecture, Arm generally commands higher royalty rates per device. This model allows the business to scale rapidly with high profit margins, because manufacturing costs fall on partner silicon foundries rather than Arm itself. Arm designs now power smartphones, automotive computing units, hardware built by Apple, and custom processors used by hyperscale cloud providers.
Where the business stands today
Arm’s financial filings show strong operational growth over the past three fiscal years, alongside significant quarter-to-quarter expansion. For the fiscal year ending March 31, 2024, Arm generated $3.2 billion in revenue, which grew to $4.0 billion in fiscal 2025, and reached $4.9 billion for the fiscal year ending March 31, 2026.
Over the trailing four reported quarters, total revenue reached $5.5 billion, representing a 23.8% increase compared to the matching four quarters a year earlier. Breaking down those four quarters shows consistent execution:
- Quarter ending September 30, 2026: $1.44 billion
- Quarter ending June 30, 2026: $1.29 billion
- Quarter ending March 31, 2026: $1.49 billion
- Quarter ending December 31, 2025: $1.24 billion
Net income over the trailing 12 months totaled $936.0 million. That builds on profits of $904.0 million in fiscal 2026 and $792.0 million in fiscal 2025.
While bottom-line profits remain steady, Arm trades at premium multiples. The stock carries a price-to-sales ratio of 37.1 and a price-to-earnings ratio of 216.6. Price history highlights this volatility: on November 13, 2024, the stock traded at $135.09, climbing 40.2% to $189.44 by November 13, 2026. Over the past 52 weeks, shares have swung between $100.02 and $452.70, after trading at $439.46 on June 18, 2026, and hitting a low of $85.82 on April 8, 2025.
What is the 12-month arm stock price forecast?
Wall Street equity analysts focus their short-term arm holdings stock forecast models on licensing backlogs and adoption rates for higher-margin architectures. Rather than relying on a single arm target price, it is helpful to look at the business developments needed to support the stock’s short-term outlook.
For Arm to build momentum over the next year, several operational milestones need to occur:
- Accelerated adoption of Armv9 technology across mid-tier mobile devices and personal computers.
- Expanded market share gains in cloud infrastructure against incumbent x86 processor architectures.
- Sustained double-digit expansion in licensing deals for specialized artificial intelligence workloads.
It is worth keeping in mind that any 12-month arm stock prediction covers immediate operational catalysts. It does not account for the multi-year multiple compression that usually happens as fast-growing software and IP companies mature.
ARM stock forecast for 2030: three scenarios
To project the long-term arm stock future out to 2030, we evaluate three potential operational cases. This evaluation starts with Arm’s current trailing revenue of $5.5 billion, applies an annual compound growth rate through 2030, assigns a realistic terminal price-to-sales multiple, and divides by a share count that accounts for standard corporate dilution.
High-growth companies rarely hold sky-high valuations forever. As annual top-line growth naturally moderates on larger numbers, valuation multiples compress toward broader technology industry standards. Today’s price-to-sales multiple of 37.1 is unlikely to endure out to 2030.
To highlight what today’s valuation implies, consider a basic break-even calculation: at a base-case multiple of 10.0 times sales and 1.14 billion outstanding shares, Arm would need to reach approximately $21.5 billion in 2030 revenue just to justify its current stock price of $189.44.
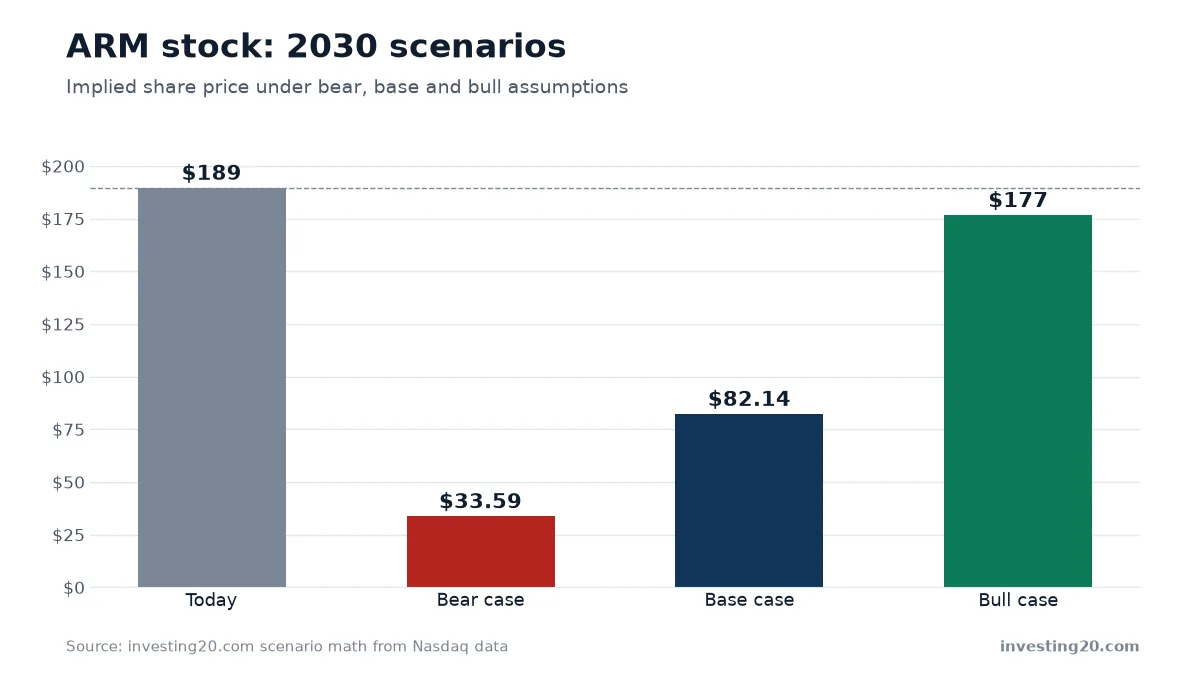
| Scenario | Revenue growth per year | 2030 revenue | Price-to-sales | Shares | Implied share price |
|---|---|---|---|---|---|
| Bear | 10% | $8.1 billion | 5.0× | 1.20 billion | about $33.59 (-82%) |
| Base | 14% | $9.3 billion | 10.0× | 1.14 billion | about $82.14 (-57%) |
| Bull | 18% | $10.7 billion | 18.0× | 1.09 billion | about $176.51 (-7%) |
Bear case
In the bear case scenario, revenue growth slows to an average of 10% annually, bringing total 2030 revenue to $8.1 billion. As growth slows, the market re-rates Arm to a mature tech price-to-sales multiple of 5.0. Spread across an expanded share count of 1.20 billion shares, the implied stock price drops to $33.59. That represents an 82% decline from the current price of $189.44.
Base case
The base case assumes Arm maintains a 14% annual revenue growth rate, driving top-line revenue to $9.3 billion by 2030. Assigning a price-to-sales multiple of 10.0 and accounting for a share count of 1.14 billion yields an implied share price of $82.14. This outcome reflects a 57% drop from current levels, showing how valuation compression can weigh on stock returns even while sales expand by billions of dollars.
Bull case
In the bull case, rapid expansion into cloud servers and higher royalty rates push annual revenue growth to 18%, bringing 2030 sales to $10.7 billion. If the market continues to reward Arm with a premium price-to-sales multiple of 18.0 across 1.09 billion shares, the implied stock price reaches $176.51. Even under this optimistic operating environment, the share price sits roughly 7% below today’s price due to multiple normalization.
Takeaway
The key takeaway from these 2030 models is that Arm’s current price already discounts strong future growth. Investors buying at today’s levels are paying a steep premium for existing revenues, meaning operational success over the next four years may not translate into proportional stock gains.
Key risks to weigh
- Valuation contraction: Trading at 37.1 times trailing sales leaves the stock vulnerable to sharp pullbacks if quarterly revenue growth deceleration occurs.
- Hyperscale competition: Large technology firms designing custom processors could explore alternative open architectures to reduce long-term licensing dependencies.
- RISC-V adoption: The open-source RISC-V computing architecture continues to gain traction, creating a low-cost alternative that could limit Arm’s pricing power on royalties.
- Mobile market dependency: While Arm is expanding into servers and automotive hardware, a significant portion of royalties still depends on global smartphone upgrade cycles.
- Share dilution: Regular equity compensation awards can increase total outstanding shares over time, reducing per-share value across long holding periods.
What to watch next
For investors keeping tabs on the arm stock forecast, upcoming earnings reports will provide early clues on long-term trends. Track quarterly royalty growth rates closely to see if premium Armv9 designs continue to replace legacy architectures. Pay attention to server core market share commentary and total contract value in licensing backlogs. Keeping an eye on whether annual revenue growth stays near recent paces will show whether Arm can maintain the operating speed necessary to offset eventual multiple compression.
FAQ
What is the arm stock price forecast for 2030?
Long-term scenario models for 2030 project potential share prices ranging from $33.59 in a bear case to $176.51 in a bull case. Because today's $189.44 price rests on high valuation multiples, expanding sales must offset expected multiple compression over time.
What is the arm price target for the next 12 months?
Wall Street analyst targets focus on short-term operational goals like architecture upgrades and licensing backlogs. However, 12-month target price figures cover immediate business catalysts rather than multi-year valuation trends.
How does Arm Holdings generate its revenue?
Arm licenses microprocessor designs and instruction architectures to semiconductor and hardware companies. It collects upfront licensing fees alongside ongoing royalties for every physical chip shipped.
What revenue does Arm need to support its current stock price?
Under a base-case valuation multiple of 10 times sales and 1.14 billion shares, Arm would need roughly $21.5 billion in annual revenue by 2030 to maintain its current price of $189.44.
Market data: Twelve Data. Financials: SEC filings. Scenario math: investing20.
This article is for information only and is not investment advice. Do your own research before investing.