Gold.com (GOLD) Stock Forecast: 2026–2030 Price Scenarios
Explore the Gold.com (GOLD) stock forecast for 2026 to 2030. We examine analyst price targets, revenue growth, and bull, base, and bear scenarios.
On this page
- What changed since our last update
- What Gold.com does and how it makes money
- Where the business stands today
- What is the 12-month gold stock forecast for GOLD?
- GOLD stock forecast 2026–2030: Bull, base, and bear scenarios
- Bear case
- Base case
- Bull case
- Key takeaway
- Risks to weigh before investing
- What to watch next
- FAQ
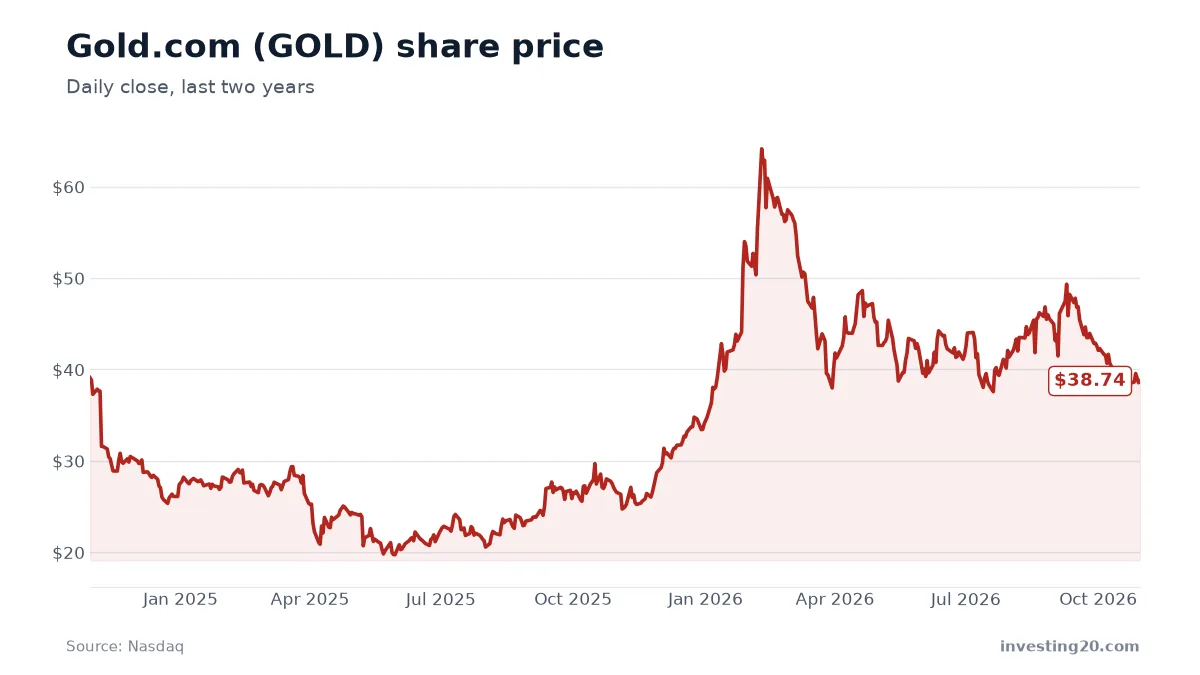
Gold.com, Inc. (GOLD) trades around $38.41 per share, giving the precious metals dealer a market value of roughly $1.1 billion. This article breaks down where the business stands today and maps out realistic revenue scenarios for GOLD stock through 2030.
Long-range stock forecasts are not guaranteed predictions. They are structured toolkits designed to show what kind of business growth is needed to justify current and potential future share prices.
| Share price | $38.41 (Nov 5, 2026 1:39 PM ET) |
| Market value | about $1.1 billion |
| 52-week range | $23.00 – $66.70 |
| Revenue, last 12 months | about $25.5 billion |
| Revenue growth, last fiscal year | 132% |
| Net income, last 12 months | about $82.3 million |
| Price-to-sales | about 0.0× |
| Price-to-earnings | about 14× |
| Analyst 12-month target | average $53.50 (range $44 – $60); 4 buy, 0 hold, 0 sell |
Market data from Nasdaq as of November 5, 2026. Check current figures before making any decision.
What changed since our last update
Since our previous update on October 30, 2026, Gold.com shares dipped slightly from $38.74 to $38.41, a 0.9% decline. The company reported its quarterly earnings on November 4, 2026, delivering EPS of $0.44 against a consensus estimate of $0.88, a 50.0% negative surprise that put minor pressure on short-term sentiment.
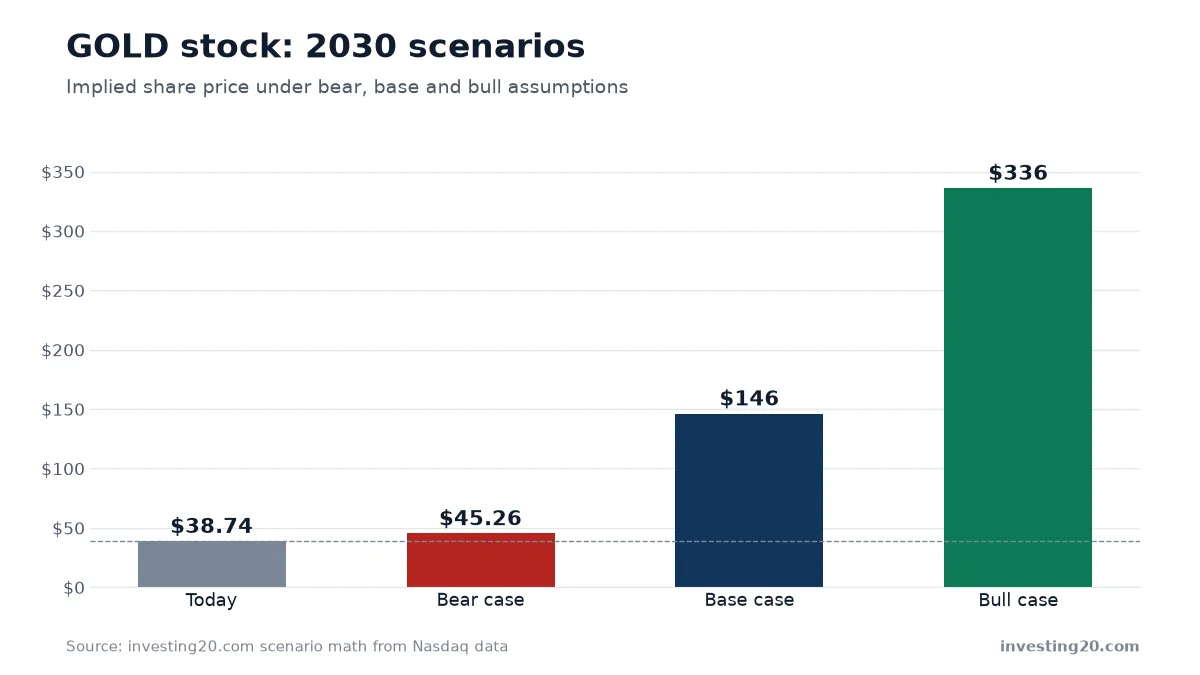
Wall Street’s average 12-month target adjusted from $58.00 down to $53.50, reflecting lower near-term margin expectations while maintaining buy ratings. Consequently, our 2030 implied scenario prices adjusted slightly lower across bear ($44.87), base ($144.87), and bull ($333.11) cases due to updated share count and cash adjustments.
What Gold.com does and how it makes money
Founded in 1965, Gold.com operates across the precious metals and collectibles market. The company facilitates transactions in gold, silver, platinum, palladium, rare coins, and currency through a vertically integrated business model.
Its direct-to-consumer platform relies on several well-known retail banners, including JMBullion.com, Stack’s Bowers Galleries, GovMint.com, Monex Precious Metals, and Goldline. On the institutional and wholesale side, operating as A-Mark Precious Metals, the firm provides financing, minting, and distribution services to sovereign and private mints globally. The firm has served as an authorized purchaser for the United States Mint since 1986.
Where the business stands today
Revenue growth at Gold.com has expanded rapidly over recent fiscal years. For the fiscal year ending June 30, 2026, total revenue reached $25.5 billion, representing a 132.4% increase over the $11.0 billion generated in fiscal 2025 and $9.7 billion in fiscal 2024.
Quarterly sales figures show significant variation driven by market volatility and precious metals demand:
- Quarter ending June 30, 2026: $5.01 billion
- Quarter ending March 31, 2026: $10.35 billion
- Quarter ending December 31, 2025: $6.48 billion
- Quarter ending September 30, 2025: $3.68 billion
The company generated $82.3 million in net income over the last four reported quarters, up substantially from $17.3 million in fiscal year 2025. Shares currently trade at a price-to-earnings ratio of 13.6.
Earnings results have varied relative to Wall Street expectations. While the quarter ending March 31, 2026, delivered a positive surprise with EPS of $3.06 against a $2.17 estimate, the quarter reported on November 4, 2026, yielded EPS of $0.44 against a consensus target of $0.88.
What is the 12-month gold stock forecast for GOLD?
Wall Street consensus data from Nasdaq shows a positive outlook among tracking analysts over the next 12 months. All 4 analysts covering the stock maintain a buy rating, with zero hold or sell recommendations.
The average 12-month price target stands at $53.50, which implies a 39.3% upside from the current share price of $38.41. The lowest analyst target is $44.00, while the highest target reaches $60.00.
For the fiscal year ending June 30, 2027, the consensus earnings forecast calls for an EPS of $3.73. Reaching these targets will likely require a stabilization in retail buying volumes and consistent transaction margins in wholesale operations. Investors watching high-volume trading platforms might draw comparisons to retail brokerage growth detailed in our Robinhood (HOOD) Stock Forecast.
GOLD stock forecast 2026–2030: Bull, base, and bear scenarios
To evaluate where GOLD stock could trade by 2030, we model three revenue scenarios starting from the trailing twelve-month revenue baseline of $25.5 billion. Because rapid top-line growth tends to normalize over time as companies scale, each scenario assumes annual growth rates moderate over the five-year period.
| Scenario | Revenue growth per year | 2030 revenue | Price-to-sales | Shares | Implied share price |
|---|---|---|---|---|---|
| Bear | 40% slowing to 5% | $55.9 billion | 0.0× | 33 million | about $44.87 (+17%) |
| Base | 79% slowing to 15% | $113.5 billion | 0.0× | 31 million | about $144.87 (+277%) |
| Bull | 119% slowing to 25% | $205.2 billion | 0.0× | 30 million | about $333.11 (+767%) |
Bear case
In the bear case, annual revenue growth slows from 40% down to 5% by 2030 (averaging about 22% per year). Total revenue reaches $55.9 billion. Assuming minor share dilution brings the count to 33 million shares, the implied stock price is $44.87, representing a modest 17% gain from today’s price.
Base case
The base case assumes revenue growth starts at 79% and tapers to 15% annually (averaging about 45% per year). By 2030, total revenue scales to $113.5 billion. With a share count of 31 million, the model implies a stock price of $144.87, which is a 277% increase over the current price.
Under our base-case assumptions, Gold.com needs to achieve roughly $30.1 billion in annual revenue by 2030 just to break even against today’s share price of $38.41. Investors interested in long-term commodity and energy trends can also review our Gran Tierra Energy (GTE) Stock Forecast.
Bull case
In the bull case, annual top-line growth begins at 119% before settling at 25% by 2030 (averaging about 68% annually). Total revenue expands to $205.2 billion. Assuming a share count of 30 million, the implied share price reaches $333.11, a gain of 767%.
Key takeaway
The wide range between the bear and bull scenarios highlights how sensitive GOLD stock is to broader precious metals market cycles. Even under modest top-line growth assumptions, the company’s valuation is heavily tied to maintaining efficient operating margins on high gross transaction volumes.
Risks to weigh before investing
- Commodity price dependency: Demand for physical bullion directly correlates with macro economic conditions, inflation expectations, and spot gold prices. Sustained periods of low volatility can reduce direct-to-consumer trading activity.
- Earnings volatility: As demonstrated by the recent quarterly EPS miss ($0.44 actual vs. $0.88 expected), quarter-to-quarter net income can fluctuate substantially based on market spreads and inventory financing costs.
- Low price-to-sales multiples: Gold.com operates as a high-volume, lower-margin distributor and dealer. As a result, its price-to-sales ratio remains near 0.0, meaning small shifts in gross margins exert a disproportionate impact on net profitability.
- Inventory financing risk: Carrying large physical reserves of precious metals requires significant working capital and exposes the business to short-term metal price swings and interest rate pressures.
What to watch next
For investors tracking Gold.com, the primary metrics to monitor over coming quarters include gross trading volumes across retail portals like JMBullion.com, inventory turnover rates, and progress toward achieving the fiscal 2027 consensus EPS estimate of $3.73.
Watch for the next quarterly earnings release to see if net margins recover from the recent earnings miss, and track physical precious metals spot prices for signs of sustained consumer demand.
FAQ
What is the 12-month gold stock price target for Gold.com (GOLD)?
According to Wall Street consensus data from Nasdaq as of November 5, 2026, the average 12-month price target for Gold.com (GOLD) is $53.50. Target prices range from a low of $44.00 to a high of $60.00, with four analysts recommending a buy.
What is the gold price prediction and revenue forecast for GOLD stock by 2030?
Our base-case scenario projects Gold.com revenue to reach $113.5 billion by 2030, which implies a potential stock price of $144.87. The bull case estimates revenue of $205.2 billion and a target near $333.11, while the bear case sees $55.9 billion in revenue and a price around $44.87.
Is Gold.com profitable?
Yes, Gold.com reported net income of $82.3 million over its last four reported quarters ending June 30, 2026. This was up from $17.3 million in the fiscal year ending June 30, 2025.
Market data and financials: Nasdaq. Scenario math: investing20.
This article is for information only and is not investment advice. Do your own research before investing.