Rocket Companies (RKT) Stock Forecast 2026–2030: Long-Term Outlook
Rocket Companies stock price forecast for 2026 to 2030. Explore analyst price targets, revenue growth trends, and bull, base, and bear valuation scenarios.
On this page
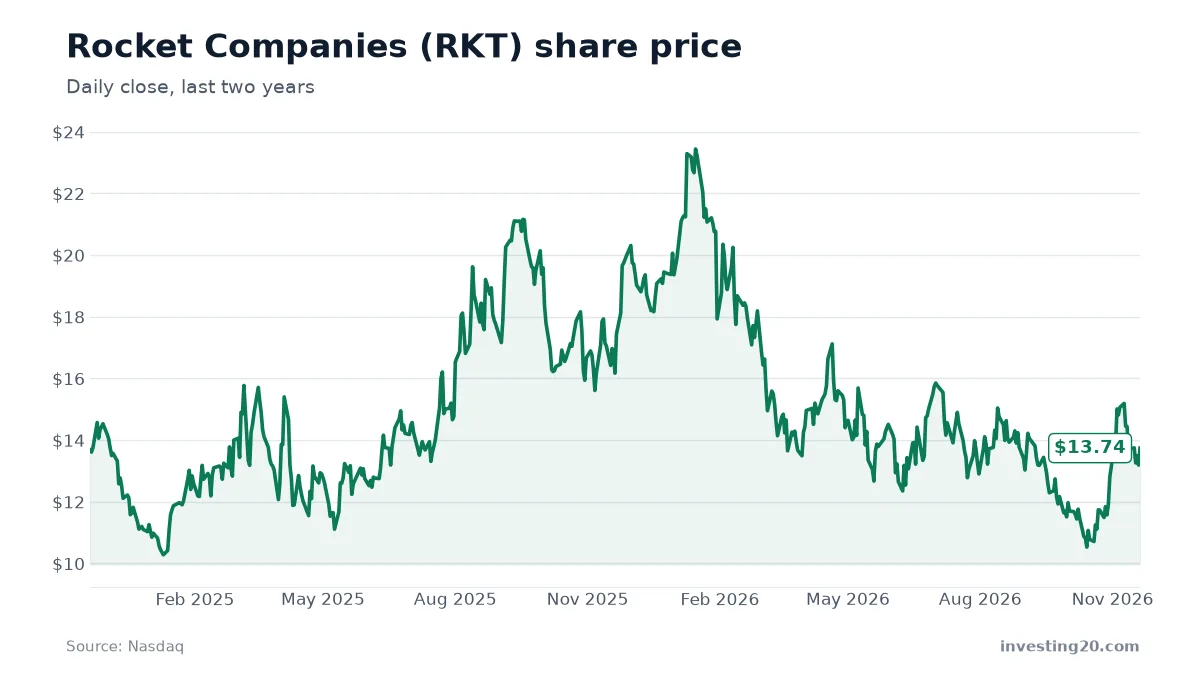
Rocket Companies trades at $13.74 as of November 20, 2026, practically flat over the past two years despite massive swings between $10.18 and $24.36 along the way. If you own or follow this stock, you are likely trying to understand whether the company’s shift into an integrated, tech-driven homeownership platform can finally turn into lasting shareholder value over the next five years.
This article reviews where the business stands today and maps out realistic scenarios for the stock through 2030. Long-range financial forecasts are not guaranteed predictions: they are mathematical models built to show what kind of business performance is already baked into today’s price, and what would need to happen for the stock to beat it. Much like our analysis in the Robinhood Markets (HOOD) Stock Forecast, we look at revenue expansion, margin profiles, and valuation multiples.
| Share price | $13.74 (Nov 20, 2026 4:35 PM ET) |
| Market value | about $39.0 billion |
| 52-week range | $10.18 – $24.36 |
| Revenue, last 12 months | about $9.0 billion |
| Revenue growth, last fiscal year | 27% |
| Net income, last 12 months | about $1.3 billion |
| Price-to-sales | about 4.3× |
| Price-to-earnings | about 30× |
| Analyst 12-month target | average $15.11 (range $13 – $19); 6 buy, 4 hold, 0 sell |
Market data from Nasdaq as of November 20, 2026. Check current figures before making any decision.
The table above captures Rocket Companies’ core market metrics as of late November 2026. The company carries a market value of $39.0 billion, backed by $9.0 billion in revenue over the last four reported quarters and a price-to-earnings ratio near 30.
What Rocket Companies does
Founded in 1985 and headquartered in Detroit, Rocket Companies (NYSE: RKT) operates a consumer homeownership platform. Rather than acting strictly as a mortgage originator, the business connects several consumer brands under one umbrella: Rocket Mortgage, Redfin, Rocket Close, Rocket Money, and Rocket Loans.
The company earns revenue through mortgage origination and servicing fees, real estate broker commissions, title and closing fees, and subscription or transaction fees for personal finance tools. Rocket Companies pairs its products with artificial intelligence tools fed by insights from more than 160 million client calls each year and 30 petabytes of consumer data. The goal is simple: lower client acquisition costs, cross-sell personal finance users into mortgage products, and streamline the entire process of finding, buying, and financing a home.
Where the business stands: revenue and profitability
Rocket Companies has seen a noticeable operational rebound after a difficult cyclical downturn. Total annual revenue grew from $3.3 billion in fiscal 2023 to $4.5 billion in 2024, before hitting $5.8 billion in 2025. That represented 27.0% annual growth for fiscal 2025. Over the last four reported quarters through September 30, 2026, top-line revenue reached $9.0 billion.
Here is how the top line broke down across the last four quarters:
- Quarter ending December 31, 2025: $2.73 billion
- Quarter ending March 31, 2026: $2.08 billion
- Quarter ending June 30, 2026: $1.83 billion
- Quarter ending September 30, 2026: $2.38 billion
Profitability has followed a similar turnaround. After reporting a net loss of $68.0 million in fiscal 2025, the company posted $1.3 billion in net income across the last four quarters.
Earnings results have met or beaten expectations throughout 2026. In the quarter ending December 2025 (reported February 26, 2026), Rocket delivered earnings per share (EPS) of $0.06, matching consensus. In the March 2026 quarter, it posted EPS of $0.13 against a $0.10 estimate, a 30% positive surprise. It met expectations again in June 2026 at $0.13 per share. Most recently, on October 29, 2026, Rocket reported third-quarter EPS of $0.12, beating consensus of $0.11 by 9.09%.
Wall Street estimates compiled by Nasdaq project full-year EPS of $0.47 for 2026, rising to $0.63 in 2027 and $0.82 in 2028.
RKT stock forecast for the next 12 months
If you are looking at the near term, the consensus rocket company stock forecast shows moderate upside. Wall Street analysts track the stock with 6 buy ratings, 4 holds, and 0 sell ratings.
The average 12-month rkt stock price target sits at $15.11, which would be a 10.0% gain from the November 20, 2026 price of $13.74. Targets range from a conservative low of $13.00 to an optimistic high of $19.00.
For the stock to hit or exceed that $15.11 consensus target over the coming year, Rocket Companies would need to maintain steady origination volume while continuing to prove that its Redfin and Rocket Money integrations convert users into higher-margin mortgage borrowers. Reaching the high end of targets ($19.00) would likely require faster EPS growth than the projected $0.47 for 2026, along with sustained momentum in the broader consumer housing market.
RKT stock forecast for 2030: three scenarios
Looking further out requires setting up scenarios rather than taking near-term analyst price targets as a given. To evaluate what an rkt stock prediction looks like through 2030, we model three paths starting from the trailing four-quarter revenue of $9.0 billion.
Our model steps down yearly revenue growth as the business expands, adjusts the price-to-sales multiple toward mature market norms, and incorporates modest share dilution. Today, the stock trades at a price-to-sales ratio of 4.3.
To break even on an investment at today’s $13.74 price, Rocket Companies needs to produce roughly $10.6 billion in annual revenue by 2030 under base-case valuation assumptions. That baseline gives us a yardstick to evaluate each case below.
| Scenario | Revenue growth per year | 2030 revenue | Price-to-sales | Shares | Implied share price |
|---|---|---|---|---|---|
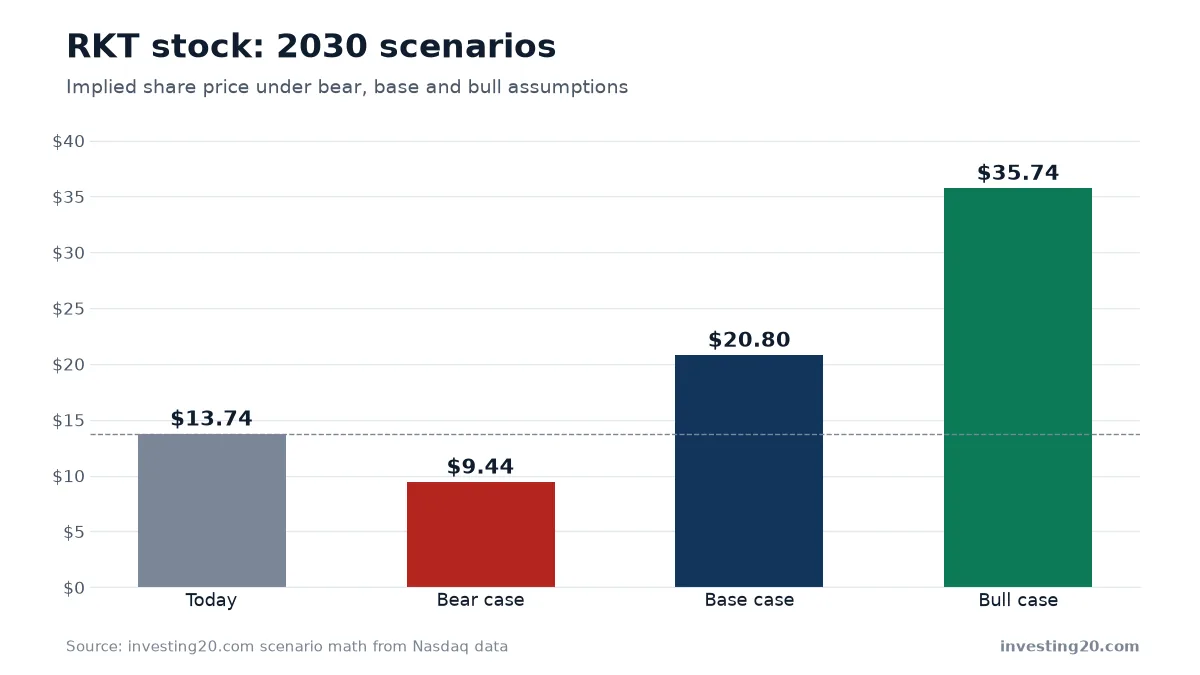
| Bear | 8% slowing to 5% | $11.6 billion | 2.6× | 3.20 billion | about $9.44 (-31%) |
| Base | 16% slowing to 15% | $16.1 billion | 3.9× | 3.02 billion | about $20.80 (+51%) |
| Bull | 24% slowing to 25% | $21.8 billion | 4.8× | 2.90 billion | about $35.74 (+160%) |
The bear case
In this scenario, consumer loan demand weakens and the cross-selling benefits between Redfin, Rocket Money, and lending fail to meet expectations. Revenue growth slows from 8% down to 5% per year, averaging about 7% annually to bring 2030 revenue to $11.6 billion. As margin expansion stalls, the price-to-sales ratio compresses to 2.6. Across a share count that expands to 3.20 billion shares, the implied share price drops to roughly $9.44, representing a 31% loss from today’s price.
The base case
The base case assumes Rocket continues to extract steady gains from its digital platform. Annual revenue growth begins at 16% and gently steps down to 15%, averaging around 16% per year to hit $16.1 billion by 2030. The price-to-sales multiple settles at 3.9, slightly below where it trades today. Based on 3.02 billion shares, this yields an implied share price of about $20.80, a 51% gain.
The bull case
The bull case reflects Rocket’s AI and platform initiatives operating at full steam. Revenue growth starts near recent paces at 24% before settling near 25% (averaging 25% annually), bringing 2030 revenue to $21.8 billion. Supported by stronger profit margins, the price-to-sales multiple expands slightly to 4.8. Assuming a tighter share count of 2.90 billion, the implied stock price reaches about $35.74, delivering a 160% return.
What these scenarios tell us
The key takeaway from this math is that today’s $13.74 share price does not require aggressive heroic assumptions to break even. Because Rocket needs about $10.6 billion in revenue by 2030 under base-case multiples, the market is pricing in modest annual growth. If you want to compare how different business models scale through 2030, you can read our Apple (AAPL) Stock Forecast or see how emerging platforms are modeled in our AST SpaceMobile (ASTS) Stock Forecast.
Risks to weigh
Before making any investment decision on Rocket Companies, keep these core operational and market risks in mind:
- Housing market sensitivity: Mortgage origination volume remains deeply reliant on home sales, consumer credit demand, and affordability trends across the United States.
- Valuation sensitivity: At a price-to-earnings ratio near 30 and price-to-sales of 4.3, the stock leaves little room for earnings misses if consumer borrowing appetite cools.
- Dilution and share structure: Potential share count expansion over time can lower per-share returns, as reflected in our 2030 scenario modeling.
- Integration execution: Bringing together disparate properties like Redfin, Rocket Money, and traditional mortgage originations requires flawless execution to justify a tech-platform multiple over a standard consumer lending multiple.
What to watch next
As you track Rocket Companies going forward, keep an eye on three specific metrics rather than daily price noise.
First, watch quarterly revenue momentum to see if the company stays on pace toward the $10.6 billion mark needed for base-case break-even. Second, track whether consensus EPS for 2027 and 2028 ($0.63 and $0.82 respectively) gets revised up or down in upcoming earnings releases. Finally, monitor whether client conversions across Rocket Money and Redfin are accelerating platform efficiency or if operating costs rise faster than revenues.
FAQ
What is the 12-month Rocket Companies stock price forecast?
According to Nasdaq consensus data, Wall Street analysts have an average 12-month price target of $15.11 for Rocket Companies, ranging from a low of $13.00 to a high of $19.00. That implies roughly a 10% gain from its November 2026 price of $13.74.
What does Rocket Companies do to make money?
Detroit-based Rocket Companies operates a consumer homeownership platform. It earns revenue through mortgage lending via Rocket Mortgage, real estate services through Redfin and Rocket Close, and consumer personal finance products like Rocket Money and Rocket Loans.
What is the long-term RKT stock price prediction for 2030?
Investing 2.0 scenario modeling projects three outcomes for 2030 based on revenue growth and valuation multiples: a bear case of roughly $9.44 (-31%), a base case of about $20.80 (+51%), and a bull case of roughly $35.74 (+160%).
Market data: Nasdaq. Financials: Nasdaq. Scenario math: investing20.
This article is for information only and is not investment advice. Do your own research before investing.