MARA (MARA) Stock Forecast 2026–2030: Long-Term Scenarios
MARA stock forecast for 2026 to 2030. Explore analyst price targets, revenue trends, balance sheet losses, and bull, base, and bear valuation scenarios.
On this page
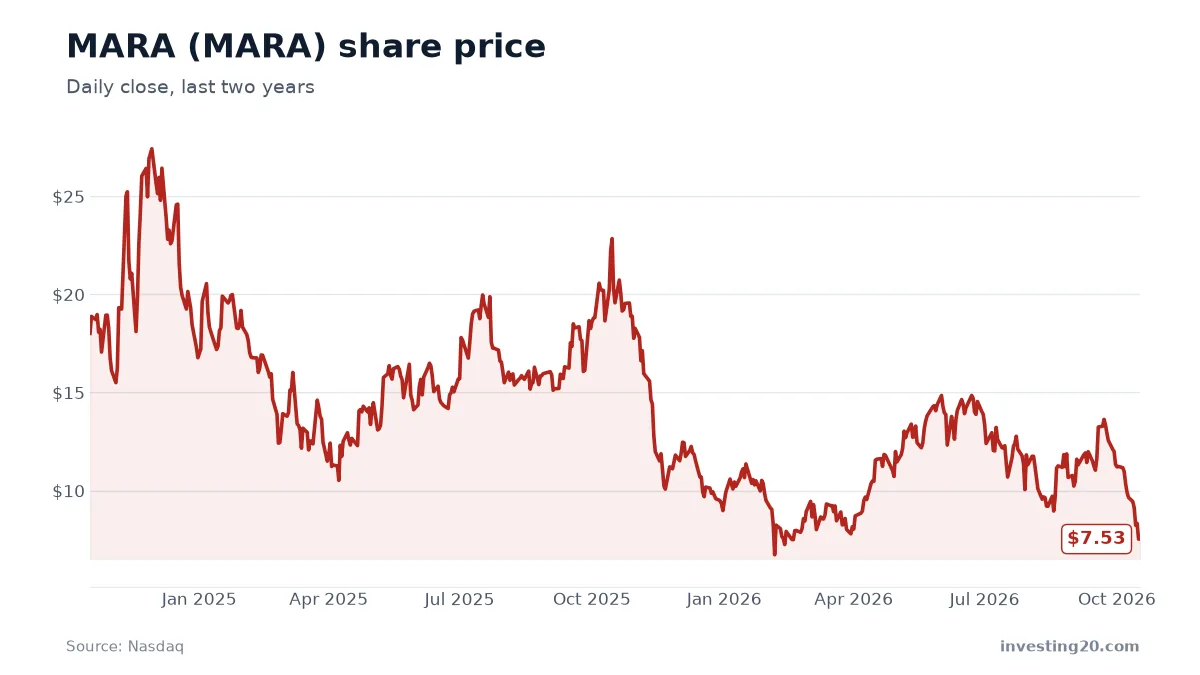
MARA Holdings stock traded at $6.65 on November 16, 2026, down significantly from its 52-week high of $16.43. In this update, we examine where the company’s financials stand today and present long-term potential valuation outcomes through 2030.
Long-range stock forecasts are not absolute predictions or promises of future price action. They are structured scenario models that demonstrate what needs to happen to top-line growth, share count, and market multiples for the stock to reach specific price levels.
| Share price | $6.65 (2026-11-16) |
| Market value | about $2.6 billion |
| 52-week range | $5.69 – $16.43 |
| Revenue, last 12 months | about $57.8 million |
| Revenue growth, year over year | -3% |
| Net income, last 12 months | about n/a |
| Price-to-sales | about 44.6× |
| Price-to-earnings | n/a (not profitable) |
Market data from Twelve Data as of November 16, 2026. Revenue and net income from the company’s SEC filings. Check current figures before making any decision.
What changed since our last update
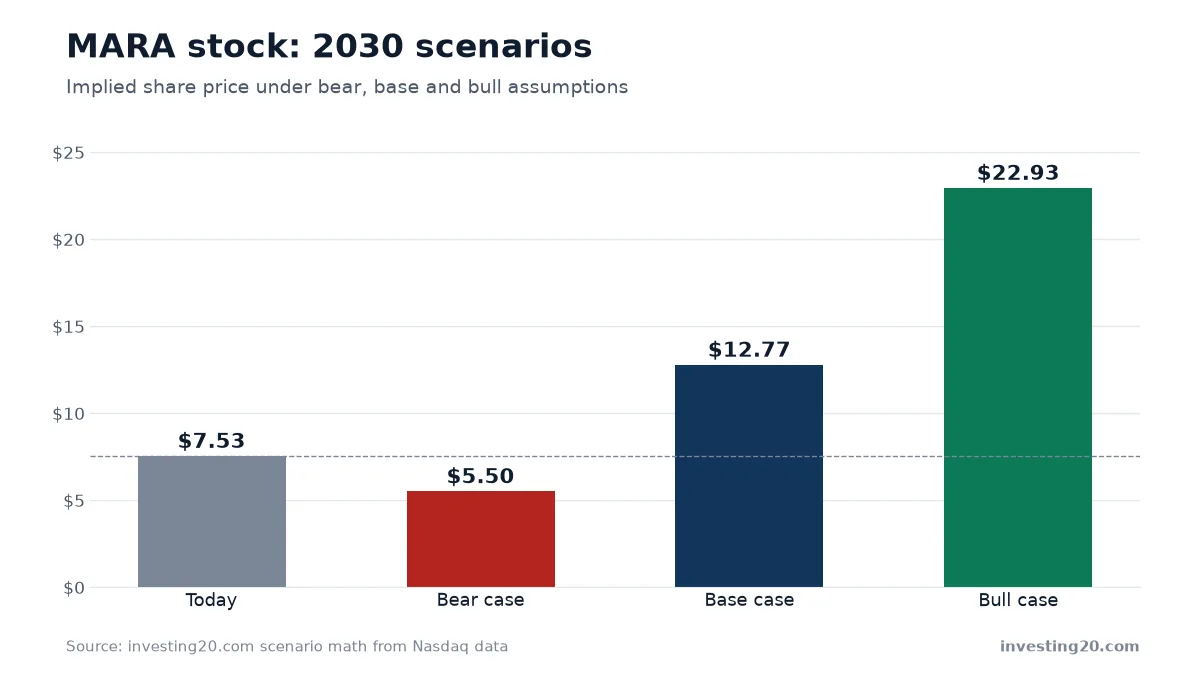
Since our last update on October 17, 2026, MARA’s share price dropped 11.7% from $7.53 to $6.65. This price weakness, combined with updated modeling parameters for long-term growth and share dilution, adjusted our 2030 price scenarios lower across all three cases. In our previous update, our scenarios pointed to $5.50 in the bear case, $12.77 in the base case, and $22.93 in the bull case. At that time, average analyst price targets stood at $15.25, though current analyst estimates are unavailable in the latest dataset.
How MARA Holdings operates
MARA Holdings operates within the financial services and digital asset infrastructure sector. The business focuses on building, owning, and managing infrastructure dedicated to mining digital assets, primarily Bitcoin.
The company generates the vast majority of its revenue by operating specialized computer hardware (application-specific integrated circuits, or ASICs) to solve complex cryptographic algorithms. In return for securing the blockchain network, MARA earns block rewards and transaction fees paid in Bitcoin. Because its primary revenue output is digital currency, MARA’s financial results remain closely connected to underlying crypto market liquidity and transaction volume.
Where the business stands today
MARA’s revenue trajectory over recent fiscal periods shows ongoing volatility. For the fiscal year ending December 31, 2024, the company generated $96.5 million in revenue. Top-line revenue subsequently declined to $58.7 million for the fiscal year ending December 31, 2025. Over the last four reported quarters ending September 30, 2026, total revenue reached $57.8 million, representing a 2.9% drop compared to the same period a year earlier.
Looking at quarterly performance over the past year:
- Quarter ending September 30, 2026: $14.60 million
- Quarter ending June 30, 2026: $13.81 million
- Quarter ending March 31, 2026: $17.41 million
- Quarter ending December 31, 2025: $11.96 million
Profitability has also swung significantly. MARA reported net income of $541.2 million in fiscal year 2024, but posted a substantial net loss of $1.3 billion for fiscal year 2025.
With a market value of $2.6 billion against $57.8 million in trailing twelve-month sales, MARA carries a price-to-sales ratio of 44.6. This multiple reflects a heavy valuation premium relative to current revenue generation, making the stock sensitive to changes in top-line growth and market sentiment. Similar valuation pressures affect other digital asset infrastructure firms like Riot Platforms (RIOT) Stock Forecast: 2026–2030 Long-Term Scenarios and Hut 8 Corp. (HUT) Stock Forecast 2026–2030.
MARA stock forecast for the next 12 months
Over the next 12 months, MARA’s stock price will depend heavily on whether the company can re-establish top-line revenue growth and stabilize its cost structure.
The stock currently trades near the lower end of its 52-week range of $5.69 to $16.43. Historically, MARA has seen severe swings; for context, the shares fell 63.5% from $18.11 on November 18, 2024, to $6.65 on November 16, 2026, reaching an interim low of $5.88 on November 5, 2026.
To improve performance over the coming year, investors should watch several short-term operational factors:
- Quarterly revenue trends: MARA needs to break out of the $13 million to $17 million quarterly range to show that operations are expanding.
- Margin recovery: Following the $1.3 billion net loss in fiscal 2025, operational cost control will be essential to reducing net cash burn.
- Capital structure changes: Given the history of equity issuance in digital mining, any additional share dilution over the next four quarters could weigh directly on per-share valuations.
Investors interested in high-beta tech or growth stocks may also want to compare MARA’s setup with evaluated models for companies like Tesla (TSLA) Stock Forecast 2026–2030: Long-Term Outlook.
MARA stock forecast for 2030: three scenarios
To model where MARA stock could trade by 2030, we start with trailing twelve-month revenue ($57.8 million) and project annual top-line growth rates. We then apply valuation multiples that align closer to mature business benchmarks and factor in potential share dilution.
Today’s price-to-sales multiple of 44.6 is extremely elevated. In our 2030 model, multiples compress toward normal industry ranges: 5.0 in the bear case, 10.0 in the base case, and 18.0 in the bull case.
To break even by 2030—meaning the stock retains today’s price of $6.65 at a base-case price-to-sales multiple of 10.0 and 387 million shares—MARA would need to generate approximately $257.6 million in annual revenue by 2030. That is more than four times its current annual sales level.
| Scenario | Revenue growth per year | 2030 revenue | Price-to-sales | Shares | Implied share price |
|---|---|---|---|---|---|
| Bear | -1% | $55.5 million | 5.0× | 403 million | about $0.69 (-90%) |
| Base | 3% | $65.0 million | 10.0× | 387 million | about $1.68 (-75%) |
| Bull | 7% | $75.7 million | 18.0× | 372 million | about $3.66 (-45%) |
Bear case
In the bear case, MARA’s revenue contracts at an average rate of 1% per year, resulting in 2030 annual revenue of $55.5 million. Assuming the price-to-sales multiple compresses to 5.0 and the share count expands to 403 million due to equity dilution, the implied share price drops to $0.69. This represents a 90% decline from the current price of $6.65.
Base case
In the base case, revenue grows at an average pace of 3% per year, reaching $65.0 million by 2030. With a price-to-sales multiple of 10.0 and a share count of 387 million, the implied share price reaches $1.68, which is 75% below today’s price.
Bull case
In the bull case, annual revenue growth accelerates to an average of 7% per year, bringing 2030 top-line sales to $75.7 million. Applying a higher price-to-sales multiple of 18.0 and assuming controlled share dilution at 372 million shares, the implied price per share is $3.66. Even in this optimistic operating scenario, the implied price remains 45% below current levels due to the expected compression of today’s 44.6 price-to-sales multiple.
Main takeaway from the scenarios
The primary conclusion from these scenarios is that MARA’s current market valuation of $2.6 billion already bakes in aggressive long-term revenue expansion. If valuation multiples normalize over the next several years toward 10 to 18 times sales, top-line growth must far outpace current single-digit performance to prevent downward pressure on the stock price.
Risks to weigh
Investors holding or considering MARA stock should keep these fundamental risks in mind:
- High valuation risk: A price-to-sales ratio of 44.6 leaves little margin for operational missteps or extended crypto market slowdowns.
- Significant net losses: The $1.3 billion net loss recorded in fiscal year 2025 highlights ongoing operational profitability challenges.
- Share dilution: Ongoing issuance of shares to fund capital expenditure expands the total share count, diluting existing shareholders’ equity stake.
- Revenue volatility: Year-over-year revenue growth over the last four quarters was -2.9%, reflecting erratic top-line trajectory compared to fiscal 2024’s $96.5 million peak.
What to watch next
Over the coming quarters, monitor MARA’s upcoming SEC filings for signs of top-line revenue stabilization above $15 million per quarter. Pay close attention to changes in total diluted shares outstanding, as share count growth directly impacts per-share value in future model updates. Finally, track whether net margins improve toward profitability as the company manages its infrastructure operating expenses.
FAQ
What is the 2030 stock forecast for MARA?
In our model, MARA's stock forecast for 2030 spans three scenarios: a bear case of $0.69, a base case of $1.68, and a bull case of $3.66. These estimates assume average annual revenue growth between -1% and 7% and compressed price-to-sales multiples.
Is MARA stock profitable?
MARA reported a net loss of $1.3 billion for the fiscal year ending December 31, 2025, down from a net income of $541.2 million in fiscal year 2024.
What is MARA's current price-to-sales ratio?
As of November 16, 2026, MARA trades at a price-to-sales ratio of 44.6 based on its trailing twelve-month revenue of $57.8 million.
Market data: Twelve Data. Financials: SEC filings. Scenario math: investing20.
This article is for information only and is not investment advice. Do your own research before investing.