GameStop (GME) Stock Forecast: 2026–2030 Long-Term Outlook
GameStop (GME) stock forecast covering the 12-month Wall Street target, revenue trends, and 2030 valuation scenarios based on realistic growth models.
On this page
GameStop (NYSE: GME) remains one of the most closely followed retail names on Wall Street, but evaluating its future requires looking past social media sentiment and focusing on the underlying business. This guide lays out where the retailer’s financials stand today and models three distinct long-range scenarios for the share price through 2030.
Long-range stock forecasts are structured scenarios based on explicit assumptions, not guaranteed outcomes. Projecting revenue, valuation multiples, and share counts several years out shows you what performance is already priced in, helping you weigh potential upside against downside risk.
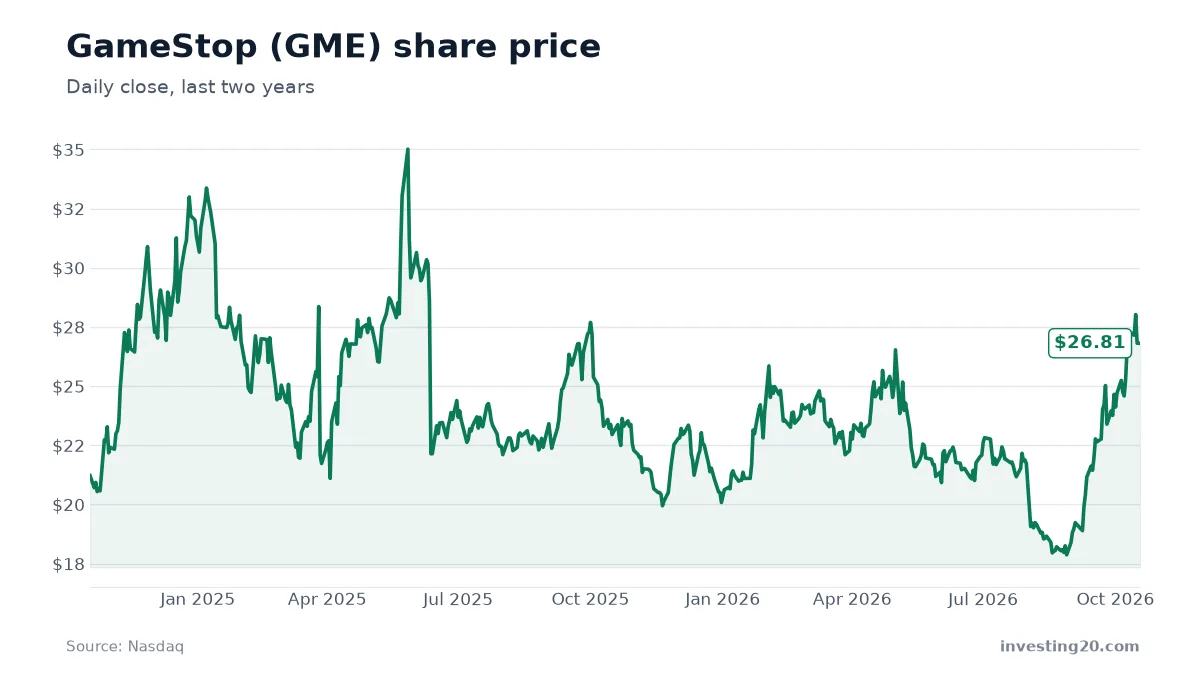
| Share price | $26.81 (Oct 15, 2026) |
| Market value | about $13.5 billion |
| 52-week range | $17.79 – $28.30 |
| Revenue, last 12 months | about $3.6 billion |
| Revenue growth, last fiscal year | -5% |
| Net income, last 12 months | about $893.3 million |
| Price-to-sales | about 3.8× |
| Price-to-earnings | about 15× |
| Analyst 12-month target | average $32.00 (range $32 – $32); 1 buy, 0 hold, 0 sell |
Market data from Nasdaq as of October 18, 2026. Check current figures before making any decision.
The table above summarizes GameStop’s current market standing, including its trailing twelve-month revenue, earnings profile, and single-analyst price target.
What GameStop does and how it makes money
GameStop is a specialized retailer operating in the consumer discretionary sector, classified under the electronics distribution industry. The business sells video games, gaming hardware and accessories, trading cards, and pop-culture collectibles through physical storefronts and digital storefronts.
Revenue flows primarily through sales of new and pre-owned physical gaming software, gaming consoles, and associated peripherals. Over recent years, collectibles and trading cards have grown in importance within the merchandising mix, helping offset secular headwinds facing physical video game distribution as digital downloads expand across consoles and personal computers.
Where the business stands: sales and profit trends
GameStop’s top-line revenue has contracted steadily over recent fiscal years. In the fiscal year ending February 3, 2024, the company recorded $5.3 billion in revenue, which dropped to $3.8 billion for the fiscal year ending February 1, 2025. In the fiscal year ending January 31, 2026, revenue stood at $3.6 billion, reflecting a year-over-year decline of 5.1%.
Across its last four reported quarters, total revenue was approximately $3.6 billion. Looking at the quarterly breakdown shows clear seasonal swings:
- Quarter ending November 1, 2025: $821.00 million
- Quarter ending January 31, 2026: $1.10 billion (holiday quarter)
- Quarter ending May 2, 2026: $835.30 million
- Quarter ending August 1, 2026: $790.20 million
While top-line sales have shrunk, net profitability has expanded significantly. GameStop reported net income of $131.3 million in the fiscal year ending in early 2025, climbing to $418.4 million for the fiscal year ending in early 2026. Across the last four reported quarters, cumulative net income reached $893.3 million. This earnings growth has brought the company’s price-to-earnings ratio down to 15.1, while its price-to-sales multiple sits at 3.8 based on a market valuation of $13.5 billion. Investors monitoring corporate transformations may also want to track our Robinhood Markets (HOOD) Stock Forecast for comparisons across evolving retail platforms.
What is the 12-month GME stock forecast?
Looking out over the next 12 months, Wall Street coverage on GameStop remains sparse. According to Nasdaq consensus figures, there is currently only 1 analyst rating on the stock: a Buy with a 12-month price target of $32.00.
At the current trading level of $26.81, that target implies an upside potential of 19.4%. Achieving that target over the next year would likely require GameStop to stabilize its quarterly revenue run rate, maintain its expanded profit margins, and demonstrate that recent cost controls do not permanently damage sales capacity.
The stock has traded between $17.79 and $28.30 over the past 52 weeks, having hit a high of $35.01 on May 27, 2025, and a low of $17.87 on August 28, 2026. Two years ago, on October 18, 2024, shares traded at $21.22, meaning the stock has gained 26.3% over that 24-month span.
GME stock prediction for 2030: three scenarios
To model a longer-term GME outlook through 2030, investing20 calculates three paths using trailing revenue ($3.6 billion), projected growth rates, potential valuation multiples, and adjusted share counts that account for dilution.
At the base-case multiple of 3.8 and a share count of 505 million, GameStop requires roughly $3.6 billion in 2030 revenue just to justify today’s $26.81 share price. That break-even figure indicates that current pricing assumes sales will hold level rather than continue their recent descent.
| Scenario | Revenue growth per year | 2030 revenue | Price-to-sales | Shares | Implied share price |
|---|---|---|---|---|---|
| Bear | -1% | $3.4 billion | 3.0× | 525 million | about $19.80 (-26%) |
| Base | 3% | $4.0 billion | 3.8× | 505 million | about $30.17 (+13%) |
| Bull | 7% | $4.7 billion | 4.2× | 485 million | about $40.24 (+50%) |
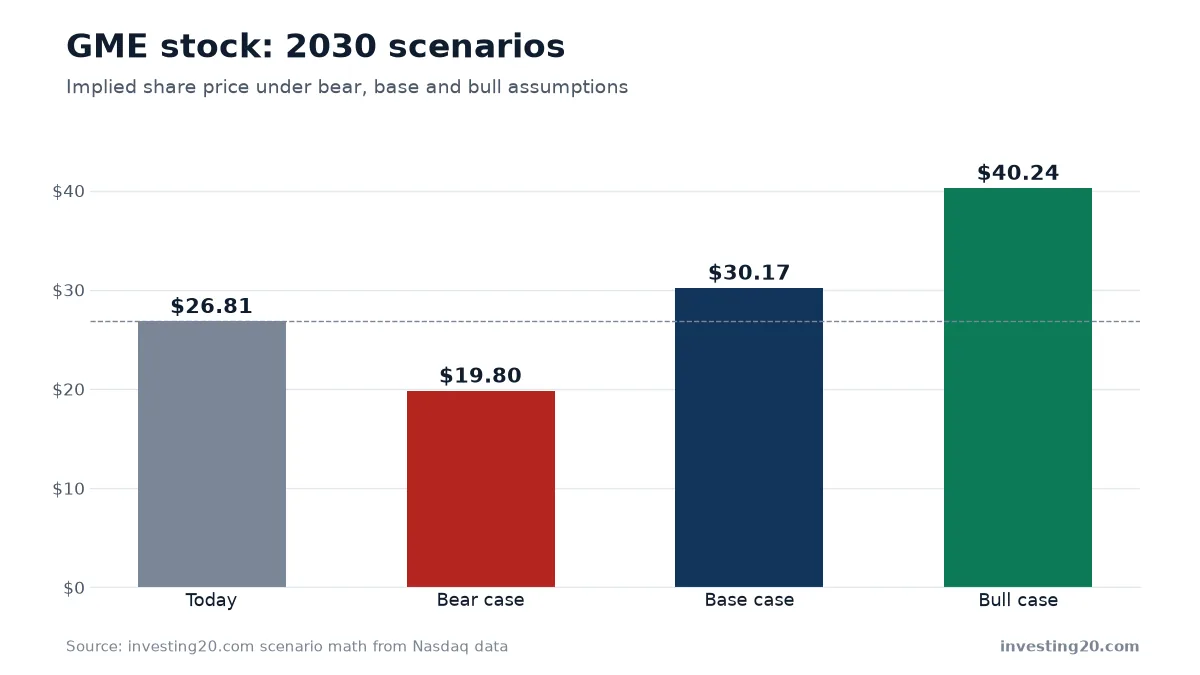
The table above details the bear, base, and bull cases for GameStop in 2030, highlighting how different growth rates and valuation multiples impact future per-share value.
The bear case
In the bear case, physical media secular declines persist, leading top-line sales to drop by an average of 1% each year. By 2030, annual revenue sits at $3.4 billion. As growth stalls, the market compresses GameStop’s valuation to a price-to-sales multiple of 3.0. Factoring in modest dilution up to 525 million shares, the implied stock price lands at $19.80, representing a 26% decline from current levels.
The base case
In the base case, GameStop successfully pivots its store footprint and expands higher-margin collectible categories, generating modest average revenue growth of 3% per year. Top-line sales reach $4.0 billion in 2030. Maintaining the current price-to-sales multiple of 3.8 on 505 million shares yields an implied target price of $30.17, delivering a 13% gain from the current price. For readers interested in how retail momentum plays into other sectors, compare these figures with our Tesla (TSLA) Stock Forecast.
The bull case
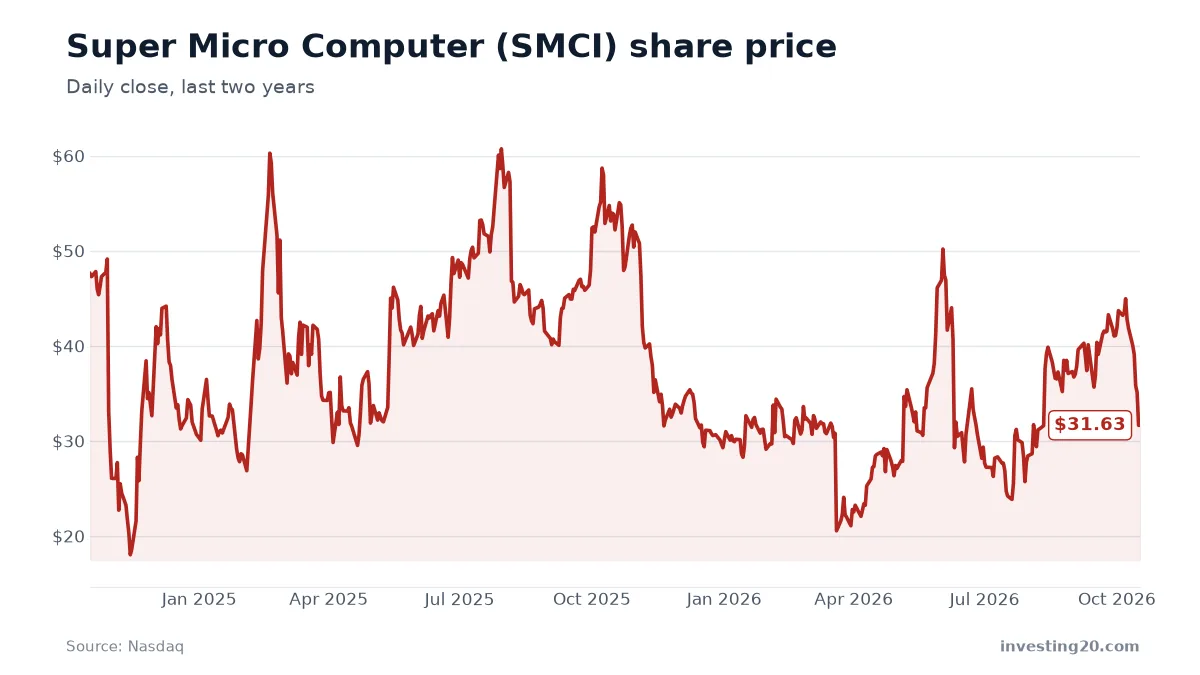
In the bull case, GameStop captures broader market share in trading cards, specialized electronics distribution, and collectibles, accelerating revenue growth to 7% annually. Revenue rises to $4.7 billion by 2030. The market rewards this turnaround by expanding the price-to-sales multiple slightly to 4.2. On a tighter share count of 485 million, this scenario produces an implied price of $40.24, an upside of 50%. Similar turnaround trajectories are explored in our Super Micro Computer (SMCI) Stock Forecast.
The main takeaway from these scenarios is that upside above $30 per share depends heavily on GameStop reversing multi-year revenue contraction. Without top-line growth, current share prices leave little margin of safety.
Key risks to consider
Evaluating GameStop requires balancing its recent profitability against structural sector risks:
- Ongoing secular decline in physical gaming: Console makers continue shifting toward digital-only downloads, reducing foot traffic for physical disk and cartridge purchases.
- Top-line shrinkage: Fiscal revenue dropped from $5.3 billion to $3.6 billion over two fiscal years, and sustaining net income without sales stabilization will be challenging.
- Limited Wall Street coverage: With only one analyst actively maintaining a price target on Nasdaq, institutional guidance is thin, leaving share price action prone to retail trading volatility.
- Valuation sensitivity: GameStop trades at 3.8 times sales; any deterioration in market sentiment or margins could quickly compress that multiple toward historical retail averages.
What to watch next
The clearest indicator of GameStop’s forward health will be its upcoming quarterly revenue reports, particularly whether sales can hold above the $800 million mark outside the holiday season. Keep an eye on operating margins to verify whether recent net income gains remain steady, and watch for any strategic updates regarding store fleet optimization or collectible category expansion.
FAQ
What is the 12-month GME stock forecast?
Nasdaq consensus data shows a single analyst price target of $32.00 with a buy rating. That target represents an upside of about 19.4% from the current price of $26.81.
What is the long-term GME stock prediction for 2030?
Long-term scenario modeling suggests an implied 2030 price between $19.80 in a bear case and $40.24 in a bull case. The base scenario points to about $30.17 if revenue expands at 3% annually.
Is GameStop currently profitable?
Yes, GameStop generated $893.3 million in net income over its last four reported quarters. That marks a continued turnaround from $418.4 million in the fiscal year ending early 2026 and $131.3 million in the fiscal year ending early 2025.
Market data and financials: Nasdaq. Scenario math: investing20.
This article is for information only and is not investment advice. Do your own research before investing.