Amazon.com (AMZN) Stock Forecast 2026–2030: Long-Term Outlook
Amazon stock forecast for 2026 to 2030. Learn how current revenue, profit trends, Wall Street price targets, and 2030 scenarios shape AMZN shares.
On this page
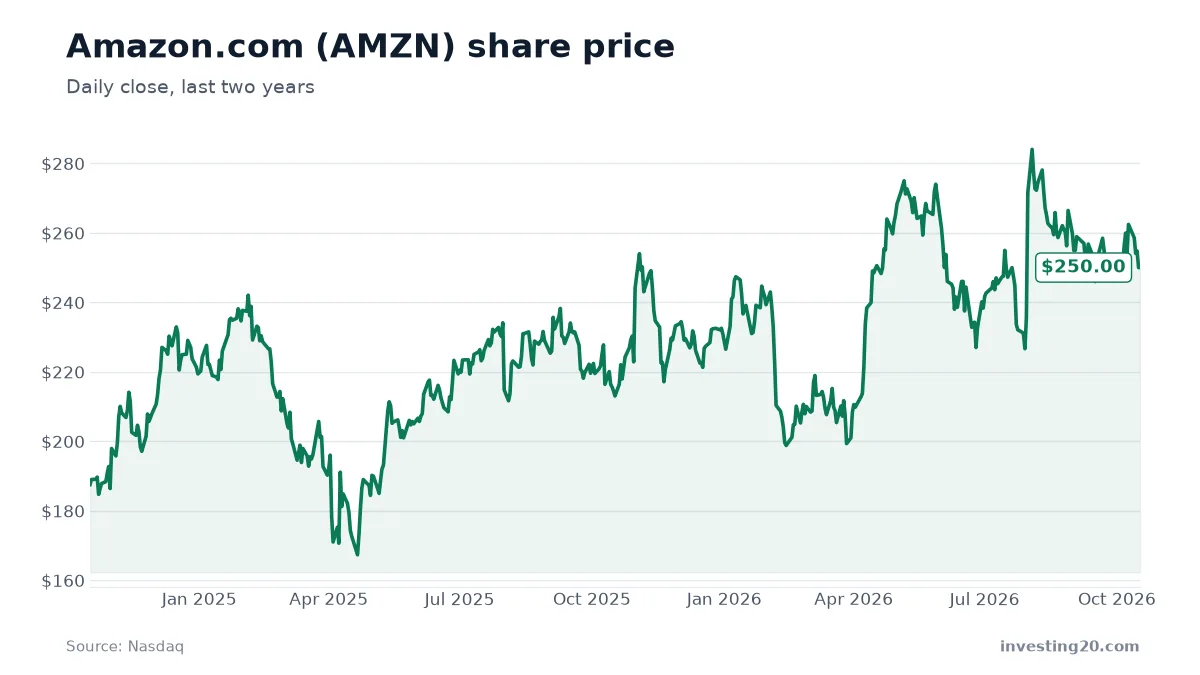
Amazon.com (AMZN) trades around $250.00, giving the global e-commerce and cloud provider a market value near $2.7 trillion. For individual investors holding shares in a standard brokerage account or retirement index fund, the big question is whether a business already generating more than three-quarters of a trillion dollars in annual sales can still deliver strong percentage gains.
This long-term stock forecast models Amazon’s potential valuation through 2030 using three distinct fundamental paths: a bear case, a base case, and a bull case. Long-range projections are not guarantees or direct price predictions. Instead, they act as scenarios that show what kind of business performance and market multiples are required to generate specific returns.
| Share price | $250.00 (Oct 15, 2026) |
| Market value | about $2.7 trillion |
| 52-week range | $196.00 – $287.20 |
| Revenue, last 12 months | about $775.7 billion |
| Revenue growth, last fiscal year | 12% |
| Net income, last 12 months | about $135.3 billion |
| Price-to-sales | about 3.5× |
| Price-to-earnings | about 20× |
| Analyst 12-month target | average $331.34 (range $230 – $400); 41 buy, 2 hold, 0 sell |
Market data from Nasdaq as of October 17, 2026. Check current figures before making any decision.
The table above outlines where Amazon stands today. With a price-to-earnings ratio sitting at roughly 20 and a price-to-sales ratio of 3.5, the valuation is far more grounded in actual net income than it was in past growth cycles.
What Amazon.com does and how it makes money
Amazon operates as one of the largest retail and technological backbones in the global economy. While consumers interact with the brand primarily through its online retail marketplace, Prime delivery, and digital entertainment, the company monetizes several distinct operational layers.
A core operational engine is Amazon Supply Chain Services. This division gives businesses of all types and sizes direct access to the freight, distribution, fulfillment, and parcel shipping capabilities that Amazon built, refined, and scaled over decades. The service supports third-party merchants regardless of whether they sell items directly on Amazon’s own platform or through external channels. By opening its global infrastructure and operational technology to outside companies, Amazon collects service fees while driving higher volume through its physical hubs.
Beyond physical logistics and merchant services, Amazon captures revenue through retail sales, digital subscriptions, advertising placements across its consumer properties, and enterprise cloud infrastructure via Amazon Web Services.
Where the business stands: revenue and profit trends
Amazon’s revenue has expanded consistently over recent fiscal years. Total revenue reached $574.8 billion in 2023, climbed to $638.0 billion in 2024, and hit $716.9 billion in 2025, which marked 12.4% annual growth. Over the last four reported quarters ending June 30, 2026, cumulative revenue reached $775.7 billion.
Quarterly revenue performance shows the steady scale of the business:
- Quarter ending September 30, 2025: $180.17 billion
- Quarter ending December 31, 2025: $213.39 billion
- Quarter ending March 31, 2026: $181.52 billion
- Quarter ending June 30, 2026: $200.61 billion
Profitability has grown at an even faster clip. Annual net income jumped from $59.2 billion in 2024 to $77.7 billion in 2025. Over the last four reported quarters, net income reached $135.3 billion.
Recent quarterly earnings per share (EPS) have produced mixed surprises against Wall Street consensus estimates. For the quarter ending September 2025, Amazon reported EPS of $1.95 against a consensus estimate of $1.58, a positive 23.42% surprise. In December 2025, EPS came in at $1.95 versus the expected $1.98 (a 1.52% miss). The quarter ending March 2026 missed estimates slightly, posting $1.56 compared to the $1.60 consensus (-2.5%). Most recently, for the quarter ending June 2026, Amazon beat expectations by 2.73%, reporting EPS of $1.88 versus the $1.83 target.
AMZN stock forecast for the next 12 months
Wall Street analysts track Amazon closely, and their 12-month outlook remains overwhelmingly positive. Nasdaq consensus figures show 41 buy ratings, 2 hold ratings, and zero sell ratings.
The consensus 12-month price target averages $331.34, with estimates ranging from a low of $230.00 to a high of $400.00. The average target represents an upside of about 32.5% from the current $250.00 share price.
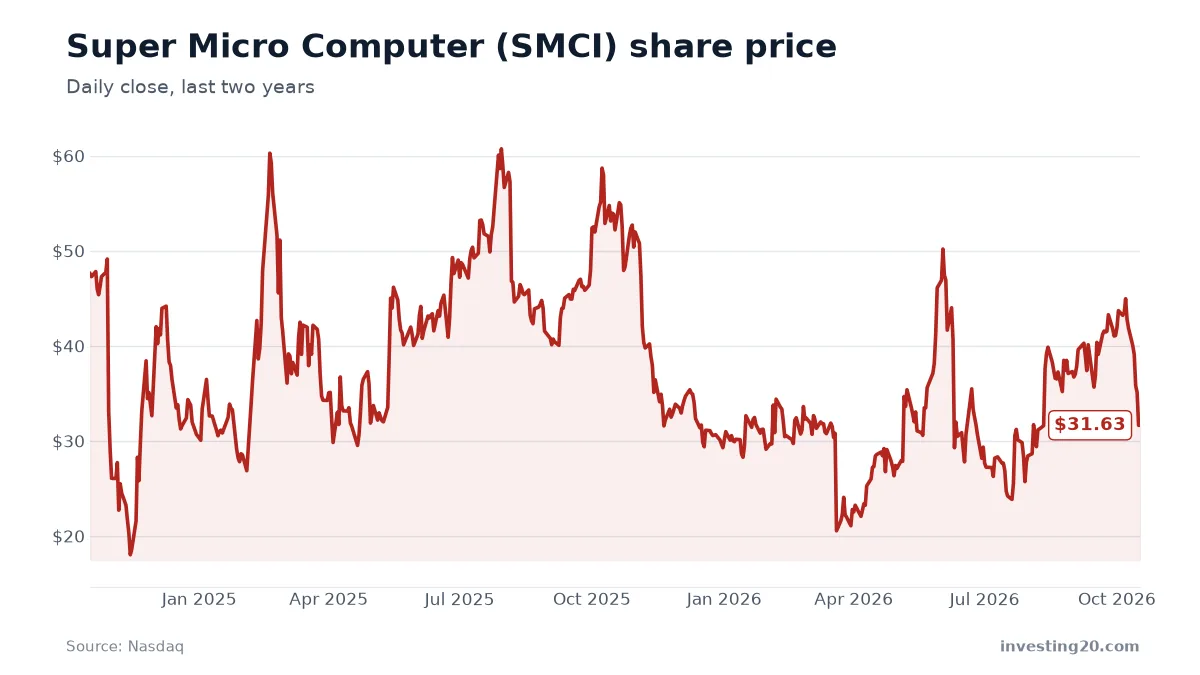
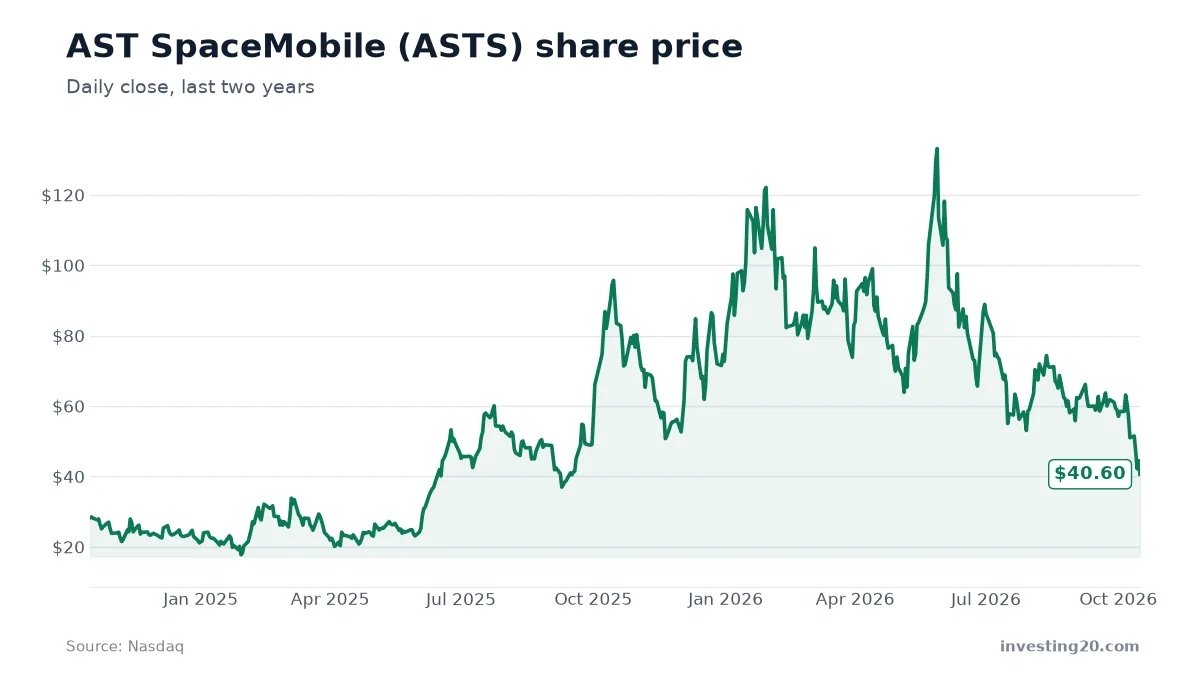
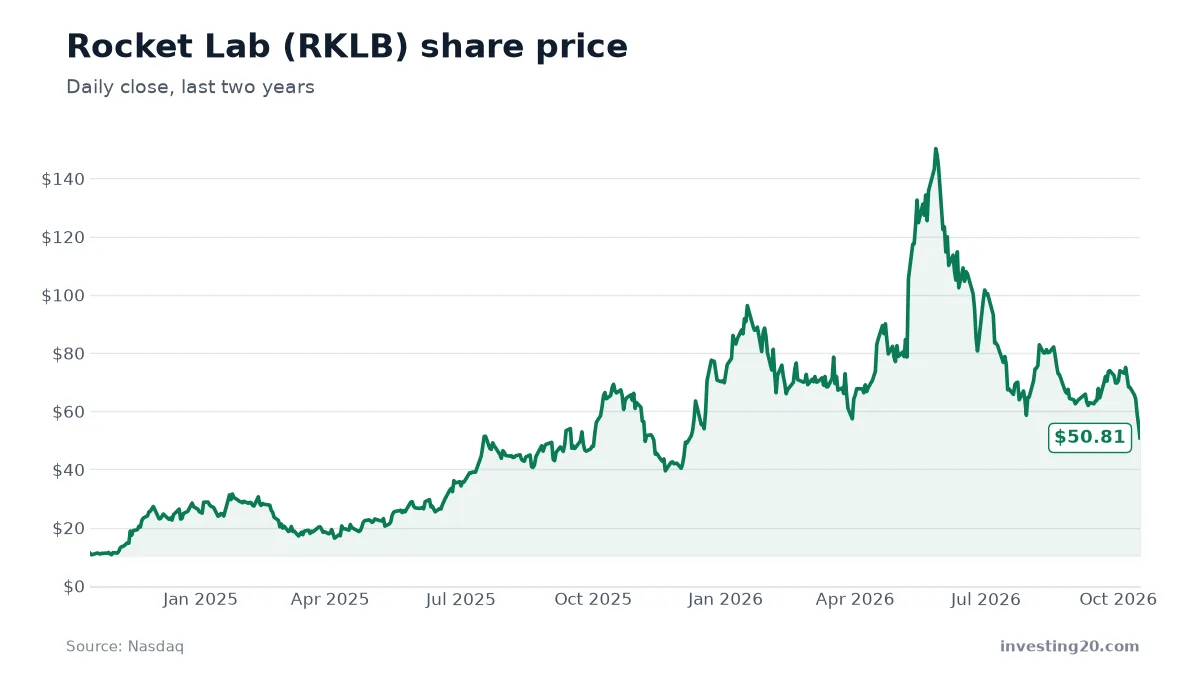
For Amazon to reach that average price over the coming year, earnings would need to meet or exceed analyst projections. Consensus estimates call for full-year EPS of $8.03 for the fiscal year ending December 2026, rising to $10.60 in 2027 and $13.92 in 2028. Continued execution in logistics efficiency and enterprise cloud spending would be necessary to keep those forward profit estimates on track. Investors tracking long-range valuations often look at other growth leaders as well, comparing AMZN’s trajectory with models like the Tesla (TSLA) stock forecast or the Rocket Lab (RKLB) stock forecast.
AMZN stock forecast for 2030: three scenarios
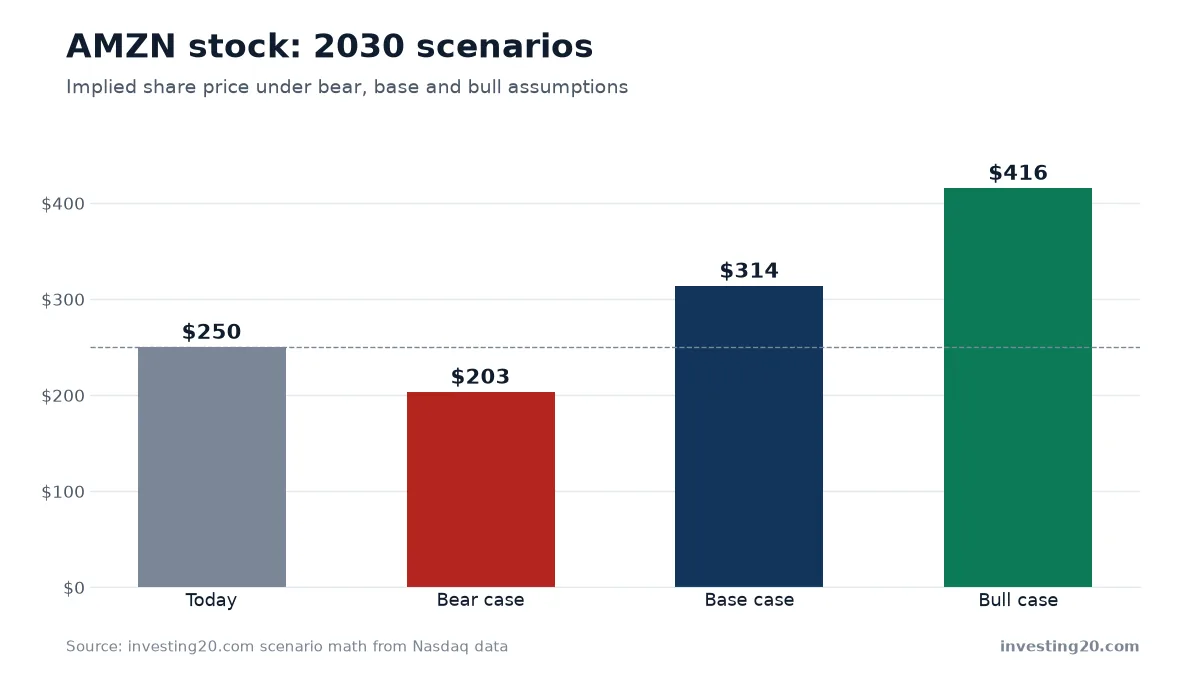
To model where Amazon might trade by 2030, we project sales growth from the trailing four-quarter revenue base of $775.7 billion, apply an assumed price-to-sales multiple, and divide by a projected diluted share count.
Because larger businesses naturally face slower percentage growth over time, growth rates in these models moderate from the recent 12.4% pace. Valuation multiples also adjust toward standard mature corporate levels. Today’s price-to-sales ratio is 3.5. At that multiple and an estimated base-case share count of 11.45 billion shares, Amazon needs about $823.3 billion of revenue in 2030 just to break even with today’s $250.00 price. In short, the market is already pricing in some moderate top-line expansion.
| Scenario | Revenue growth per year | 2030 revenue | Price-to-sales | Shares | Implied share price |
|---|---|---|---|---|---|
| Bear | 3% | $887.6 billion | 2.8× | 12.14 billion | about $203.33 (-19%) |
| Base | 7% | $1.0 trillion | 3.5× | 11.45 billion | about $313.71 (+25%) |
| Bull | 11% | $1.2 trillion | 3.8× | 11.00 billion | about $415.55 (+66%) |
The bear case
In the bear case, annual revenue growth slows sharply to an average of 3% per year, pushing 2030 sales to $887.6 billion. A combination of economic slowdowns and regulatory pressure compresses the valuation multiple to 2.8 times sales. Factoring in share dilution up to 12.14 billion shares, the implied stock price is approximately $203.33, representing a 19% drop from current levels.
The base case
The base case assumes Amazon expands revenue at an average rate of 7% per year, crossing the $1.0 trillion revenue mark in 2030. Assuming the price-to-sales multiple remains steady at 3.5 and the share count settles at 11.45 billion, the implied share price lands near $313.71. That equates to a 25% gain from the current price, or steady single-digit annualized returns. Readers who follow earlier projections like our Amazon stock price prediction will recognize that even modest growth on a massive base creates immense dollar value.
The bull case
In the bull scenario, Amazon sustains stronger demand across supply chain operations, advertising, and cloud services, growing revenue by an average of 11% annually to reach $1.2 trillion by 2030. If the market rewards this steady double-digit execution with a slightly higher multiple of 3.8 times sales, on a share count of 11.00 billion, the implied stock price would be about $415.55. That would generate a 66% gain over today’s price.
The primary takeaway from these scenarios is that Amazon no longer trades like an unproven speculative stock. Upside from here relies heavily on steady execution, incremental margin gains, and defending its core valuation multiples.
Risks to weigh
Before making any changes to your portfolio, consider the specific operational and market risks Amazon faces:
- Growth drag from size: Generating substantial percentage growth becomes harder as revenue approaches $1 trillion per year.
- Valuation compression: If growth slows to low single digits, the market could re-rate the stock to a lower price-to-sales multiple, muting returns even if sales rise.
- Macro consumer weakness: High inflation or reduced consumer discretionary spending can directly impact e-commerce sales volumes and merchant delivery activity.
- Enterprise budget pullbacks: Reductions in corporate technology spending can slow cloud growth and crimp profitability.
- Capital allocation and share count: If stock-based compensation outpaces share repurchases, dilution will reduce per-share equity value.
What to watch next
The next milestone for investors is Amazon’s upcoming quarterly earnings release. Watch whether quarterly revenue maintains the $200 billion benchmark and verify if net income continues to track toward the consensus $8.03 full-year 2026 EPS forecast. Beyond bottom-line numbers, pay attention to merchant adoption rates inside Amazon Supply Chain Services, as third-party logistics utilization remains a critical driver for profit margins heading into 2027.
FAQ
What is the average 12-month analyst price target for AMZN?
According to Nasdaq consensus data as of October 2026, the average 12-month target is $331.34, representing about 32.5% upside from the recent $250.00 price.
What revenue does Amazon need to justify its current stock price through 2030?
At its base-case multiple of 3.5 times sales and 11.45 billion shares, Amazon would need approximately $823.3 billion in annual revenue by 2030 to maintain its current $250.00 share price.
What is Amazon's current valuation multiple?
As of mid-October 2026, Amazon trades at a price-to-sales ratio of 3.5 and a price-to-earnings ratio of 19.9, based on trailing four-quarter revenue of $775.7 billion and net income of $135.3 billion.
Market data and financials: Nasdaq. Scenario math: investing20.
This article is for information only and is not investment advice. Do your own research before investing.